PINNACLE POINTERS
Pinnacle Pointers are sent to your email on Fridays.

The Importance of the Time of Day
As members of the Pinnacle Institute, you know the importance of rules, and how strict we are in following them. Rules develop a process, and they also remove emotion if we choose to stick to them. Nobody has a crystal ball, and the market can only be predicted to some degree. Therefore, probability must always be stacked in our favor. The Pinnacle methodology of qualifying zones and ensuring the risk to reward potential of our opportunities is critical to ongoing consistency and trading success.
In the Pinnacle Method, there is a step-by-step process of identifying and qualifying trading opportunities ahead of time. There is simply no excuse for jumping into the market without a plan. Behavior of this nature represents the mentality of the novice. We must approach the market as professionals, waiting for price to come to us with the intention to buy at demand and sell at supply. This process is the foundation which lays the ground for everything else. However, depending on what we trade, and when we trade, there can be additional filters or ways to stack the odds in our favor, if we approach our analysis in a logical manner. ‘
A logical approach that we employ in our Open Exchange sessions is the use of Regular Trading Hours (RTH) vs Extended Trading Hours (ETH). In previous articles, we detailed how and why RTH charts are preferable to ETH charts. If you remember, regular trading hours incorporate the hours of 9.30am to 4pm ET, the regular US Stock Market hours. Extended hours are the hours outside of RTH, and are mainly used when charting Futures markets, as these often trade 24 hours a day for almost 6 days a week, much like Forex.
We focus on using the RTH charts when day trading Futures in the Open Exchange. The zones and levels we find during the regular trading hours, typically comprise of greater volume. This means that they potentially have a greater probability of holding when tested, as they were created with greater volume in the first place. In simple terms, these supply and demand imbalances resulted from large discrepancies between the buy and sell orders of major institutions and banks. Such entities have huge buying power, which ergo leads to larger reactions.
Now that we have reviewed this concept, let’s focus on the next. A common question we receive is related to if the RTH levels are hit in the ETH of trading. Look at this chart below and we will explain further:


On this chart you can see some of the areas are in white while the other areas are shaded in grey. The white areas you can see are Regular hours (9.30am to 4.00pm ET) and the grey areas are the extended hours outside of the RTH. The grey sections are bigger because the ETH session is longer in pure hours than the regular session.
You will notice that supply and demand zones are created throughout both sections but in this case, we will be focusing on the white areas for our zones only, as these represent the highest volume opportunities. We have marked out a quality zone of demand on the far right of the chart, with little basing and clean structure. Now that this has been highlighted, we will be waiting for price to return to this level in the future for a trade setup. Ideally, this will happen during the RTH.
In this next chart however, we can see that the zone was hit overnight first, before being hit in the regular hours:

This is the question we get regarding this exact situation: “Are regular hours levels still valid if they have been hit pre-market or overnight?” The simple answer is yes, they are still valid.
The primary reason we favor RTH chart levels is because they have been created on higher volume, as we discussed earlier in the article. Yet there is another reason why they are preferable. RTH charts also line up with stock charts and ETF charts. This example we are looking at is of the ES Futures. The ES futures runs in line with the SPY ETF, as they are basically the same product or market, just in a different format. The SPY is one of the highest traded products in the world and only trades during the RTH. Therefore, when we trade the RTH chart of ES, we are lining up our zones with the same zones on the SPY, meaning their probability of holding is even greater.
As we can see, later that day when the regular market was open, the same demand zone was triggered and held just fine:

We must almost imagine that the ETH activity does not exist when we see a scenario like this. All that matters is where the markets open when the 9.30am bell rings. Whenever levels look like they have triggered overnight, remember they can still be used during the cash market session. Take note though: these RTH zones should only be used when hit during the RTH itself.While it may seem a little complicated initially, this concept is worth getting your head around and it will, in time, simplify your day trading in many ways. In our world, simpler is always better! TRADING & INVESTING IDEAS
CAD/JPY – Canadian Dollar vs Japanese Yen
The Setup:
Currently in fair value, this pair has some untested levels above and below the range. Lack of fresh demand offers great downside potential rewards.
The Logic:
In times of weakness, the larger profit potential trades will be offered at supply. Finding zones outside of current Fair Value will always provide better setups.
The Zones

EUR/AUD – Euro vs Australian Dollar
The Setup:
This currency pair is ranging right now but has supply and demand zones outside of the current range for setups both above and below. The lack of market direction makes both supply and demand valid in this case.
The Logic:
Fresh and untested zones are typically the better opportunities, as the imbalances are likely stronger and offer the higher probability ad greater reward.
The Zones:

Simple Rules for Simple Trendline Strategies
Trendlines are an interesting concept. On one hand, they are foundational to price action itself and are key to analysis. Markets trend constantly, both up and down and trendlines are a great way to mark off these important market stages for both entries and exits. On the other hand, they can be incredibly subjective when being drawn. Much is based upon what we think we see, rather than what we objectively recognize from price. There are schools of thought which state that a qualified trendline needs at least 3 points to be confirmed. Others believe that a simple break of a trendline means the trend is over. Let’s make things a little cleaner.
First, if you wait for 3 touches to confirm a trend, then you will likely be joining it too late and missing much of the action. Instead, we like to use 2 initial anchor points and project the trendline forward. This gets us into the action sooner. Secondly, a break of the line may just be a false signal to run stops. Therefore, we would look for a close above or below the trendline to confirm it is over. Look at the example below for a better idea. They are a great tool, but to fully make use of them, you must be more proactive and logical in their implementation

Synthetic Stock: The benefits of stock ownership… without the cost
For over a century Americans have looked to the stock market to generate wealth and fortunes. However, for many people the stock market has been out of reach, perhaps never more than now, because of the cost of the stocks people want to own.
Buying one hundred shares of some stocks can be prohibitively expensive. As of 01/06/2023, one hundred shares of Netflix, at $313 a share, would set you back $31,000. Facebook (Meta), $13,000. One hundred shares of Google, post split, would cost almost $9,000.
What if you could get almost all the benefits of owning the shares, of being long stock, for a fraction of the cost?
If you buy one hundred shares of any stock, you’ll get a dollar of profit for every dollar the stock rises. But you have to shell out a lot of money to buy the shares, taking on potentially large risk if the stock tanks.
However, what if instead of buying the shares outright, we could get creative, and create a “synthetic” long stock position that would also profit dollar for dollar as the stock rises?
By buying a call option, and selling a put option, (both with the same strike price and expiration date), we can participate in a stock’s move with, in many cases, very little upfront expense.
Understand, this is a bullish trade that should be entered only when you have reason to expect the stock to rise, at a demand zone. Whether buying actual stock to create a long, bullish position, or buying a “synthetic” bullish stock position, we need the stock to rise to profit, and we’ll take a loss if it drops.
In the below example, ZM is at a demand area at $65, and we’d expect the stock to rise from demand. At the current price of $65 a share, one hundred shares would cost $6,500. And if we’re following prudent money management rules, even if you were willing to put only 10% of your account in one trade, you’d need a $65,000 trading account. For 20% of the account at risk, you’d still need a $32,000 account.
Long calls are bullish as it gives the buyer of the call the right to buy the stock at that strike price regardless of how high the stock goes. Short puts are bullish as it obligates the seller to buy shares of stock at the strike price if assigned. Whether you have the right to buy a stock, or are obligated to buy a stock, you must be bullish, and you need the stock to rise to profit, and you’ll take a loss if it drops.

Let’s go out to May and buy a May 65 call and sell a May 65 put. We’ve entered two bullish positions for a fraction of what it would have cost to buy one hundred shares.
Let’s do the math:
Synthetic Stock Long Stock
BTO May 65 Call $10.20
STO May 65 Put $9.60 100 shares $65/share
Net Debit $0.60 Net Debit $6,500
Options are sold in contracts which give traders the rights and obligations to trade shares in one hundred share blocks. A debit of $0.60 would cost $60 per contract.
Which is more cost effective? $6,500 for one hundred shares, or $60 for one contract? Some of you must be thinking… what’s the catch? There’s no catch. Options are a leveraged asset. Even if you just bought the May Call option for $10.20, that’s only $1,020 for the bullish call option, as opposed to $6,500 for the one hundred shares. Again, leverage.
Even if we bought a deep in the money call option, with a Delta of 1.0, the cost is only $31.00, or $3,100 for the contract, which is still less than half the cost of buying the one hundred shares outright.
How do we profit from the actual position or the synthetic position? Say our profit target was $80. If we bought one hundred shares at $65 and sold them at $80, we’d realize a $1,500 profit on our $6,500 investment. A solid 23% rate of return.
Cost Value at Target Profit
Long stock $65 $80 $15
Let’s do the math on the synthetic position with the stock at $80 at expiration.
Cost Value at Expiration Profit
May 65 C +$10.20 $15.00 $4.80
May 65 P -$9.60 $0.00 $9.60
Net Debit: $0.60
Net Profit: $14.40 – $0.60 = $13.80
With the stock at 80, the 65 C will be worth $15, showing a profit on the call, and as long as the stock closes over 65 at expiration, the 65 P will expire worthless, resulting in another profit on the put.
If you liked a 23% ROR on the long stock position, how about a 2300% ROR on the synthetic stock position?! The profit was $13.80 on a $0.60 investment.
Now, as there are no guarantees in life, and any trade can go against us for any reason, let’s look at the downside risk. The max loss on the stock if it went to zero is $6,500.
Max loss on the synthetic position? The most we could lose on the 65 C is $1,020. And the max loss on the short put, if the stock went to zero, is $6,500. However, we sold the put, and collected, $9.60, or $960 at entry, so the most we could lose on the short put drops to $5,540.
Max loss long 65 C $1,202
Max loss short 65 P $5,540
Net Max Loss: $6,742
So, while the synthetic position has a slightly larger max loss, in reality, we’d never ride a stock down to zero, and we had to tie up substantially more money to enter the trade.
If we expand our notion of what exists, of what is possible, options can give us multiple ways to profit in the markets while minimizing risk when trades don’t work out.
Of course, it is imperative to understand how options work in addition to the rules of supply and demand. For those that would like to learn more about options, look to attend the next Pinnacle options class, or join us Monday afternoons in the Arena.
12 Rules for the 12 Months Ahead – Part 2
We hope you had an incredibly happy holiday season and are excited for what is to come in 2023! Two weeks ago, we shared the first half of our top tips for the coming new year. As promised, here we have the second half to implement into your trading plan for 2023.
7 – Trade Price not Indicators
The Pinnacle Method of analysis and execution should always be your primary decision maker. It can often be tempting to bring extra indicators into the mix, but be cautious.
One of the dangers of relying too much on these secondary tools is that they require price to give us a signal. This will always result in a lag and delay in the signal itself. That delay causes the trader to get into a position far too late, and it negatively affects the overall risk and potential reward outcomes.

By focusing on price, we will typically get the best signals at the earliest time. If you know how to read price on a chart, you will understand how to recognize the true footprints of the major market players.

Institutions create patterns due to the imbalances of their order size compared to the retail customer’s order size. If you develop a keen understanding of this concept, you will know exactly where to get into the market for maximum trade potential. Price is the best leading indicator.

8 – Limit Your use of Technical Indicators
We should also remember that technical indicators, if used correctly, are a powerful tool to help the decision-making process. When utilizing supply and demand levels, sometimes we may find too many trading opportunities. Technical indicators can be useful in helping to filter these opportunities.

Technical indicators such as moving averages, bollinger bands, and other oscillators can give extra support to the supply or demand level opportunities. However, the technical indicator should not be the primary decision-making tool and should be used only after the trader has identified a qualified level based on the Pinnacle Method. If you are planning to employ technical indicators, choose one or two to aid you in your analysis process. This way, there will be little danger of focusing more on the technical indicators rather than price.
9 – Focus on a Few Timeframes
This point is short and simple: less is more. If you look at too many time frames when trading in any asset, you will find it harder to pull the trigger. As traders we need to be able to make decisions on the spot and with clear rule-based objectivity. More timeframes mean more complications.

Multiple timeframe analysis is a key skill which needs to be developed if you are to ever achieve overall consistency in your trading. We would look at no more than three or a maximum of four timeframes when trading. This will give you a broad picture of fair value and overall market direction. Using any more than this could potentially result in you forcing a trade, meaning that you flip through multiple charts to find an opportunity because you are desperate to take a trade, rather than wait for the right trade. Remember, trading really is a game of waiting.
10 – Keep a Trade Journal
This one always seems obvious, but it is surprising how many people have never thought about it before. We all come to the market wanting to trade, to get into the action as soon as possible to make money. The last thing we really think about is journaling and tracking our actions.

Well, here is some news for you: you need to record your activity in your trading. How can you ever analyze what you have been doing if you do not record what you have been doing? The only way we can learn about what works and what doesn't work is by keeping a journal of our trading activity and then learning from it. Start a journal now and track your performance from this day forward. Most traders are just looking for consistency, and the only way to truly become consistent is to be consistent. Your journal will help you achieve this.
11 – Don’t Become Isolated
Trading is a lonely business. Most new traders love the idea of making money on their own terms but forget that this also comes with the disadvantage of it being a very solitary career or activity. Other careers usually include going to work where you have breaks and communicate with others. When you're sitting at home in front of a computer screen, typically the only person you can talk to is yourself and let's be honest, self-talk is usually not a good thing in trading.

People need people. Our Pinnacle Arena is an ideal meeting place for our members. Sharing your goals with individuals on the same path as yourself often supports more successful results. Put yourself in a group with other like-minded individuals and emulate the success of people who are good at what they do. Going at it alone is not always the best course of action. We often forget that we are typically most like the people we spend most of our time with.
12 – Hold Yourself Accountable
As people, we are responsible for our own lives and the decisions we make. Trading is a decision-making process at its core and requires us as market speculators to take responsibility for the choices we make to buy, sell, and manage our risk. We all need to understand that our success is dependent on us and us alone. We are only trading what we believe about the markets and what we believe is true, isn’t it?
TRADING & INVESTING IDEAS
GBPJPY – British Pound vs Japanese Yen
The Setup:
The GBPJPY has seen a strong sell off, with a current recovery rally these last few weeks. The price is currently sitting at fair value with supply above and demand below. Both longs and shorts can be considered.
The Logic:
When markets are in equilibrium, there is no directional bias and both extremes can be considered. These ranges are ideal for low risk and high potential reward set-ups.
The Zones
166.13 – 166.99

LOW – Lowes Companies Inc
The Setup:
Lowes has been strong considering the broad market weakness over the last few weeks. This makes it solid for both buying and selling opportunities. It is in the middle now but when it reaches unfilled gaps, we have the signal to enter.
The Logic:
Combine ranging markets with gaps at supply and demand, and we have ideal trade entries. Gaps always represent the larger price imbalances and should be considered if they meet the required qualifying process.
The Zones:

Maintaining Risk Management Effectively
Most of us have heard of the 1-2% rule: never risk more than this percentage of your trading capital on a trade. This makes perfect sense and, depending on your frequency of trading, strikes a nice balance. A 2% risk on swing trades is ideal, as you should be taking fewer trades across the week or month. When it comes to day trading on the other hand, 1% to 0.5% risk per trade is ideal. There will likely be more trade opportunities in a day, leading to the potential for over-trading. Limiting the risk to a smaller amount can take the edge off a losing streak. However, it is vital to remember that the risk percentage should be seen as total exposure. Taking 1% risk on 5 trades at the same time is a total exposure of 5%, way above what we would recommend. Keep this in mind, and if you have multiple opportunities presenting themselves to you, the risk can always be split across them by breaking down the percentage you intend to risk. Also, if you are at breakeven on one of a group of trades, you can always enter a new position with the risk allocated to a new entry, letting you run the existing trade for free effectively.
Managing expectations is one of the most important skills a trader or investor can develop. When things are going well, we often want them to be better still. When the pressure is on and the losses are racking up, it can be just as difficult to know when to stop and live to fight another day in the markets. Good day or bad day aside, we need to always enforce discipline and manage not only our own expectations, but also what we can expect of the market. We have always been in support of classic technical analysis tools, but only when used in the right context. The Pinnacle Method will always provide our buy and sell signals.
Generating Cash Flow From Stocks You Own
We own stock for one reason: to make a profit. Most investors who are looking to profit from owning stock need the stock to go up to generate a profit.
However, what if we could use the stock to generate cash flow without the stock having to go up?
Once you own shares of an optionable stock, you can sell call options against that stock position that will have the goal of accomplishing one of two things:
Generating weekly or monthly cash flow.
Getting paid to sell your stock at a premium above the stock price you were prepared to sell the stock.
Many of you might be familiar with call options when buying calls. Buying a call option gives the buyer the right to buy shares of stock at the strike price no matter how high the stock goes up. However, when we sell call options, in exchange for collecting a premium, we’re taking on an obligation to sell shares of the stock at the strike price if it closes at or above the strike price at expiration.
The covered call strategy involves selling a call option at a strike price where you don’t think the stock will get to before the option expires. So, say a stock is trading at $217, and has been trading in a range, with the distal line of a supply zone at $219.

If the distal line of a valid supply zone is 219 and the zone holds, we probably wouldn’t be expecting the stock to go higher than that. What if we sold a 220-call option, and collected a premium of $2.05? We collected $2.05 a share, or $205 per contract, and in exchange we took on an obligation to sell the shares at $220, but only if the stock closed at or above $220 on expiration day.
And if the valid distal line of supply is 219, our expectations are the stock won’t get to 220, and we won’t have to fulfill our obligation to sell the shares. Here’s the best part, even though we don’t have to fulfill our obligation to sell the shares, we get to keep the $2.05!
Just like your insurance company gets to keep your premium when the policy expires if you don’t file a claim.
And if the option expires worthlessly and we don’t have to fulfill the obligation, what can we do AGAIN?
Sell another call at another expiration date further out and collect another premium.
And in the example below, you could have sold at least six 245 calls at the 245-strike price over a seven-month period… and collected multiple premiums, while never having the stock called away.

Now, while you’re generating cash flow every time you sell a call and collect a premium, you’re also lowering your cost basis on the stock you already own. And the “worst” case scenario? The stock rises above the strike price, and you must sell your stock. But you’re selling at a price above the supply zone, and for a premium because you collected money when you sold the call and took on the obligation.
Now just to be clear, the income generating covered call strategy we’ve discussed does necessitate owning stock and owning a minimum of 100 shares of stock. (Options give you the right or obligation to buy or sell shares of a stock in 100 share increments). So, there is of course the risk of the stock dropping and incurring a loss, potentially a large loss on the stock that wouldn’t come close to being offset by the covered call premium collected. Selling covered calls should not be used as a substitute for having a stop loss to protect the investment.
For more information on covered calls, or to learn how to implement the strategy, look into the Pinnacle Institute’s options class or investor program.
12 Rules for the 12 Months Ahead – Part 1
Another year is coming to an end. For some 2022 has been a good year and for others, an uphill struggle. No matter where you are, this is the ideal time to hit the reset button and get things in order to face the upcoming market activity of 2023. The very best signal of success or failure in trading is typically going to be down to the quality and implementation of our trading plan.
With the trading plan nailed down, you are inviting yourself to become unemotional. Remove the emotions and you also remove the temptation to trade without discipline. Nobody can ever predict what is going to happen next in the marketplace, therefore we need to have guidelines in place to tell us what to do when certain criteria and events occur. The end goal is to be consistent and see what works and what doesn’t work.
With the dawn of 2022 approaching fast, we thought this would be a good time to share with you the first half of 12 rules (the rest to follow in Part 2) that could be of use across the coming year:
1 – Manage Downside
Often overlooked and commonly misunderstood, risk management needs to be the priority that any trader has in their plan. The only way to make money, is to ensure that you have enough in your actual trading account to place a trade. The smaller the account the smaller the returns, therefore we need to protect our account because the more we have, the more we can protect and grow that account to make better returns over the long run. When the money is gone from our account, our trading career is over. That money in the account needs to be seen as a tool to produce a consistent return. This will never happen unless the money is protected at all costs. Follow the “3 Strikes and Out” rule to manage your drawdowns.
2 – Develop Entries Avoid being too tight with entries and allow room for the trade to work. Too often we see members setting stops too tight or making entries too narrow. This often leads to missed entries and quick stop-outs, only to see the market move in our predicted direction afterwards. Don’t be afraid to enter on large timeframe zones with smaller positions sizes and wider stops and entries. Give yourself a chance to be successful by avoiding overworking a zone and getting cheap on an entry. Remember that stops must be placed in defensive locations to avoid the stop hunters.

3 – Understand Profit Targets
Why would you ever take a trade if you didn’t know where you were going to get out for profit? Nothing is more frustrating than seeing profits forming on a position, only to then watch them go all the way back to breakeven or maybe even into a losing situation. One way to overcome this is to know before you take a trade where your profit target will be and how to do this as objectively as possible. Knowing when to get out for profit is just as vital as knowing when to get in for an entry. We use Fair Value as the initial profit taking area, regardless of anything else. Fair Value acts as a magnet for price and the middle of the nearest Fair Value region is an objective first target for maximum risk to reward.
4 – Trust and Be Patient
One of the easiest things to do when sitting at your computer is to click the buy or sell button, especially in a choppy market. Impatience is a killer in trading. When we see an area of demand, we know that we should be buyers and when we recognize an area of supply, we set up our orders to sell. It is as mechanical as that. If solid levels don’t present themselves to us, then move on to another market or come back another time. Patience is a virtue in this business.
5 – Respect the Fundamentals
While the Pinnacle Method is rooted in pure price action trading, we shouldn’t ignore fundamental relationships. There are many intricate fundamental relationships present between the US Dollar and other related markets which can help to increase the odds of success when trading. Knowing the impact of the US dollar and Oil on currency, as well as a variety of other markets like bonds and stocks, can help the disciplined trader to know how to better time their entries. However, we must also recognize that sometimes that the inverse relationships do not work. Always trade objectively and use correlations as a probability enhancer, not a guarantee. Take trades because of the setup itself and not because of a fundamental relationship alone.
6 – Use News the Right Way
News can lead to great entries at qualified supply and demand areas. It can also drive sentiment so powerfully that levels get blown through in the blink of an eye and make us question our trading decisions. Nothing should impact your emotions in trading, especially the news. Regardless of the news report, plan and execute the trade as normal. Don’t think about the outcome, focus on the process. Sometimes you will get the result you desired and other times you will feel like you couldn’t be more wrong. It doesn’t matter. None of us knows what will happen in the next few minutes, so we play the odds in our favor and never deviate from the plan we’ve set under any circumstance. Avoid reading too much into the news and sentiment and stick to what the chart shows you. After all, if the news was the answer, anyone who could read would be a successful speculator.
Look out for Part 2 of this series in the coming weeks of Pinnacle Pointers. Happy Holidays to you and your loved ones!
TRADING & INVESTING IDEAS
GBPUSD – British Pound vs US Dollar
The Setup:
The GBPUSD has seen a strong recovery rally these last few weeks but is reaching Weekly Supply, with the US Dollar also at Monthly Demand. This will test the integrity of the downwards momentum with a short at Daily Supply.
The Logic:
Large time-frame levels combined with inverse help are high probability setups. Selling at Supply with momentum on our side, also helps the odds of the trades.
The Zones
1.2486 – 1.2558

IWM – Russell 2000 ETF
The Setup:
Broad Market weakness offers an opportunity to sell at new Supply as new lows are being created. The IWM has been leading the pack to some degree, making it the best short play for now.
The Logic:
In times of weakness we sell, and we sell the weaker of the markets. Using a Supply zone which created a Gap in price, also suggests a major imbalance at the entry area.
The Zones:

Expectations and ATR
Managing expectations is one of the most important skills a trader or investor can develop. When things are going well, we often want them to be better still. When the pressure is on and the losses are racking up, it can be just as difficult to know when to stop and live to fight another day in the markets. Good day or bad day aside, we need to always enforce discipline and manage not only our own expectations, but also what we can expect of the market. We have always been in support of classic technical analysis tools, but only when used in the right context. The Pinnacle Method will always provide our buy and sell signals.
However, any supplementary tool to aid us in our objective analysis and enhance performance is welcome. This is why the Average True Range (ATR) indicator can offer some assistance. The ATR is helpful because it gives us an idea of the expected range of the current candle bar. For example, when used on a weekly chart, it shows the expected range of that week. If used on a 60-minute chart, it would detail the expected range of that hour and so on. On a daily chart it would look like this:

The highlighted ATR reading shows $6.11, which is what the average daily movement is expected to be, based on current volatility. This reading will change as volatility changes but gives a general idea of what to expect.
With this in mind, when we have large moving days, it can stop us from chasing price when we are at the ATR extremes. In the chart above, we can see how after a strong rally into the marked supply zone, it was better to consider the short rather than chase the long. We had reached ATR extremes and hit daily supply. Obviously, markets can move well beyond the current ATR reading but this still gives us an objective way to manage our expectations for the next move coming and how to plan in a disciplined manner.
Check Yourself and Your Challenges Before You Start Trading
Most people want to get involved in self-directed trading because what they focus on is the ‘amazing new life’ all the profits from trading will provide. This thinking, while typical, is very dangerous. It is usually filled with blind spots that always guarantee that the profits you dream of, will instead be losses and a nightmare. It is critical to first focus on the challenges you will likely endure, and have a plan for them before you start trading. The group that focuses on the ‘prize’ tends to lose their money to the group that focuses on the challenges. It is one group who is providing income and wealth for the other- that’s trading. While there are many potential challenges, we will focus on two that we believe are key.
Self-Control
If you don’t have self–control (discipline) in other parts of your life, don’t think you will magically have it when you start trading. In fact, trading will challenge your discipline more than you can imagine.
From birth, we run to things that make us feel good and run from things that we are afraid of. Proper trading and investing actually requires you to have to think the opposite if you want to succeed. Here’s what we mean…
We want to buy low and sell high, right? Well, to buy low (when prices are cheap), you need to buy when most people have sold. When that happens, you will be experiencing red candles, down sloping indicators, often accompanied by bad news, and so on. The act of buying low and selling high is NOT comfortable when trading and investing.
Profits and Losses
People love profits and do not like losses. This often leads to people taking profits quickly when they have them, and refusing to take losses because they simply do not want to lose. This action is quite common and typically leads to a short trading career. Successful market speculators tend to take losses quickly, when their plan tells them to, and they hold onto gains until they reach their pre-determined profit target. In other words, they plan their trade and execute their plan. For investors who only buy and hold in the stock market, they typically buy with no plan for risk and no plan for profit. Having a plan for both results is crucial.
Before you embark in you trading and investing pursuits. Be sure you check your challenges, or your challenges will be sure to check you.

TRADING & INVESTING IDEAS
SBUX – Starbucks Inc.
The Setup:
SBUX is trading near the middle of a very large Profit Zone with a very qualified Supply zone above and Demand zone below.
The Logic:
Typically, the larger the Profit Zone, the higher the probability price will turn at these zones.
The Zones
109.80 – 111.90

GLD – Gold Trust ETF
The Setup:
GLD has rallied strong from a Demand Zone with plenty of room above to the Supply Zone.
The Logic:
Notice the strong rally as price moved away from the Demand Zone. This typically represents a large Supply and Demand imbalance at the zone.
The Zones:

BA – Boeing
The Setup:
BA is nearing a Supply Zone above with a Demand Zone quite a ways below. Profit zone is key here.
The Logic:
This opportunity offers a large Profit Zone. Profit Zone and Probability go hand in hand. The larger the Profit Zone, typically, the greater the Probability.
The Zones:

Economic Reports and Price
Every month we have economic reports released by the government during market hours or during pre-market trading. These are often triggers for significant market moves as new Supply and Demand comes into the market based on people’s perception of the report.

An unexpected number from the report invites a lot of Supply or Demand into the market. An expected number means the market likely will not move much, as little new Supply or Demand comes into the market.
Notice the NASDAQ chart above. Price declines to our qualified Demand zone the day before the Fed (Federal Reserve) report. This is when we can buy with a lower risk, higher reward, and strong probability long entry. The next day, the Fed report came out, the news was bullish, a lot of new Demand came into the market and the market rallied strong.
The key for today’s lesson, which is a common occurrence, is this…Often, price will trade into a qualified Supply or Demand zone the day BEFORE the key economic report comes out. Most traders try and trade when the report comes out and run into quite a bit of trouble as price can move far and fast. Most people don’t see the lower-risk entry the day before the report, when it is often available.
Let The Market Lead Us
You have likely heard people tell you to “let the market guide you” when trading and investing, but do we really know and understand what this means? Typically, this is in reference to understanding and analyzing the price action of the market. The term “price action” can be confusing as a concept to grasp initially, so let us take a simpler look into ways to both understand price action and use it to our advantage.
When we attempt to define the concept of price action, in simple terms we are looking for evidence of market strength, weakness or equilibrium. The Pinnacle Method focuses on the major turning points which are created as the result of market imbalances.
These areas, without question, will always offer us the greatest opportunity to enter trades with the lowest risk and the highest potential reward. However, when combining both qualified supply and demand zones, with an understanding of price action, we potentially have a powerful combination.
The key to making things simple is to first define strength, weakness, and balance. Strength will be shown when prices move higher in an upwards trend. Weakness is when the market is falling lower in a downtrend and equilibrium can be seen when the market is ranging. When we see sustained movement higher or lower, it makes sense to follow the momentum. When the market is ranging, or in a prolonged state of fair value, we aim to play the extremes in both directions.
The next step is to combine this plan with using our supply and demand areas with price action study. For example, in strength we should look to buy pullbacks to quality demand areas. In times of weakness, we short rallies into qualified supply zones. Finally, we can enter at both supply and demand areas with conservative targets when the price action is showing fair value.
Often you will find that you must wait things out when market direction is far from clear. This scenario was present recently when we were analyzing Corn Futures (ZC) for a setup in the Close Exchange. At the time of analysis, the corn market was clearly in a state of fair value, or equilibrium. Here is a shot of the chart below, on a daily timeframe:


Now while there is nothing wrong with playing the range at either extreme, we should remember that eventually the market is likely to break one way or the other. Guessing which way this breakout will be, is just what it sounds like: guess work. You will also notice that the marked supply and demand areas are not of the highest quality either, meaning that leaning on these areas too much will decrease any odds of success for these areas to hold.
With this in mind, the best course of action moving forward, is to simply wait for the market to lead us. Should ZC break higher or lower, it will potentially form a new area of entry for our consideration. A few days later, that is exactly what it did, as shown below:

Draw your attention to the prior demand area which was broken as the price moved lower. We can see that when this area was broken, the market created a new area of supply. Think about why this is important. There were more buyers in the area before the break of price support. However, when the buy orders were all absorbed, this would have required an abundance of supply. These sell orders (supply) created their own zone in the same area as the previous demand.
We look at areas like this, as transition areas, meaning that it can be objectively assumed that the initial imbalance of buyers to sellers, then became an area where the sellers now overwhelm the buyers. This new supply zone can then be used as an opportunity to sell short on corn futures, after the market showed clear weakness from the break of previous price support.
Waiting for the market to guide us like this, requires both patience and discipline for traders and investors of all experience levels. Often when a market breaks higher or lower, we are tempted to chase price, only to watch it pull back and stop us out. The alternative is to wait things out, allow the market to show its hand and act accordingly. The morale of the story: always trust and be patient.
TRADING & INVESTING IDEAS
DVN – Devon Energy Corporation
The Setup:
As the broad markets are determining their next direction on the larger timeframes, we can see DVN has been marking its own territory, with swings higher and lower. In this instance we can play both sides of the market.
The Logic:
Without clear, broad market correlation, it makes sense to look for equities, which are mostly directionless. In this instance, DVN fits that requirement and gives us quality opportunities to enter at both supply and demand.
The Zones
77.14 – 78.77

FTNT – Fortinet
The Setup:
FTNT has been showing some slight weakness over the last few quarters but has recovered recently and is now offering opportunities at both supply and demand areas for long and short plays.
The Logic:
The supply zone on this chart offers an unfilled gap with some secondary evidence to complement. Shorting at supply in the extremes of a range is ideal. The lower demand area although tested slightly, is a great representation of wholesale demand, which can also be considered as a buying opportunity.
The Zones:

When to Widen the Net
Near-misses in trading can be a frustrating occurrence. Think about those times when you have done the analysis, qualified the zone and set up the trade. You followed the rules. You set your stop losses and targets, letting things play out as they should. However, a little later when you came back to check how the trade played out, you see that your entry was almost too good! By too good, we mean the price almost touched your zone within a whisker and then worked out perfectly, leaving you behind to see the move happen without you. This happened at a recent level we were ready for on Gold Futures (GC) only last week, shown here:

The upper supply zone triggered perfectly, only slightly piercing the entry line, before dropping to the opposing level of demand. However, the demand zone offered a great buying opportunity, which almost triggered, but then went without us. Sometimes you must accept this, however, a good practice if this is happening regularly is to make some slight adjustments to the entry.
In the Pinnacle Method course, we recommend setting your entry a little earlier than the proximal line. We suggest around 10% of the size of the zone as a benchmark. It could be useful to keep a record of how much extra room you give on your entries, so you don’t miss these opportunities in the future. Obviously, it will compromise your risk to reward ratio but if your entries are too tight, and are costing you winning trades, an adjustment like this could be a smart consideration to make.
Are Options Riskier Than Stocks?
In previous newsletters I’ve pointed out all the benefits options have over stocks. From leverage, to increased rates of return, to even being able to have the ability to profit when wrong directionally on the trade.
Yet, for all the benefits that options bring to traders and investors, options have the reputation of being the riskiest asset. While every asset has risk, even “safe” mutual funds, why do options have the reputation of being the riskiest asset?
Well, it turns out that most options traded expire worthless. So, is that a good thing or a bad thing?
To expire worthless, options must have something that no other asset has, and they do… They have an expiration date. So, when trading options, you not only have to be right about the trade, but you also must be right with the clock ticking. You must be right before a deadline.
Stocks don’t expire, if you buy a stock, do you care how long it takes to get to your profit target? If you don’t get stopped out, how long can you stay in the trade? Forever!
Trading stock is like a baseball game, because theoretically it never has to end. If you’re down 5-0 in the bottom of the ninth, nobody on base, two outs, with two strikes on the batter, is the game over? Nope. If you don’t get the third out, and keep getting hits, you can come back and win, no matter how long it takes. There’s no expiration to a baseball game, there’s no clock ticking.

You could buy a stock like CROX, which in 2007 dropped from $75 a share to $0.79 a share in fifty-four weeks! And it did come back… 14 years later, in January 2021, it was back at $75! Could you have held on all that time?
But if you’re down 17-0 in a football game with thirty seconds on the clock, the game’s over. You won’t even get the ball back three times, let alone score three times.
So, while trading stock is like a baseball game, trading options is like football, basketball, soccer, or hockey. You not only have to win, but you also must win with the clock ticking. Who remembers that game show from the 70’s, “Beat the Clock?”
Now, is it a good thing or a bad thing that most options expire worthless? Well, it depends on whether you bought or sold the option.
How do you make money in America? For most people, anything you buy, you need it to go up in price to sell it for more than what you paid for it.
Most Americans are bullish, and buy stocks and/or mutual funds, hoping to sell it for more than what they paid for it if the price rises. But if something you bought drops, and eventually becomes worthless, well, that’s a very bad thing.
However, what if you sold short? Then expiring worthless is a beautiful thing! When selling short you not only wan the stock to tank, but you also want the stock to go to zero! You want the company in bankruptcy before the trade settles!
As I mentioned earlier, the majority of options expire worthless, and for those who bought options, if they expire worthless, they not only take a loss on the trade, but they also lost 100% of their investment.
Stock traders rarely, if ever, lose 100% of their stock investment. Why? Because a stock must go to zero for that to happen, and most stocks don’t go to zero.
Zero is zero, right? So, what’s the difference? Well, while zero may be zero, when buying call options, which are bullish options giving the buyer of the call the right to buy stock, the stock doesn’t have to get anywhere near zero for the call option to be worthless at expiration. The stock just has to drop below the strike price of the call option.

In the above example, TSLA closed at a demand area at around $210 a share. If a trader bought shares of TSLA at $210, the stock would have had to go to zero for the trade to be worthless.
However, if an options trader bought a 210-call option, expiring in 90 days, regardless of what they paid for it, the stock would just have to close at or below $210 at expiration for the option to expire worthless. TSLA wouldn’t have to get anywhere near zero for the trade to be a total loss. If the stock did nothing, closed in ninety days where it was the day they opened the trade, the option would expire worthless for a total loss on the trade.
In other words, say a novice trader doesn’t understand the mechanics of options, time decay and volatility, or what happens to option premium as the option gets closer to expiration, they could be starting at a total loss, without ever getting stopped out on the trade!
At the Pinnacle Institute we’ll show you not just how supply and demand effects price movement on the stock, but how to effectively trade options so that when an option expires worthless, it could end a profitable trade for you.
Adapting to the Globex Trades
Consistency in trading is critical to progress. Changing rules and strategy repeatedly will only lead to confusion and frustration for most traders, causing their morale to decline. By being consistent, the trader discovers if something works or if it doesn’t. Read that back to yourself: The trader needs to discover what works and what doesn’t work. Engaging in a repeatable process every day in trading is what allows traders to reach this consistency.
Twice a week, we hold the Open Exchange sessions, focusing mainly on short -term trading opportunities which may trigger at or around the US Stock Market open. Many trades do hit within the first 30 mins of the day. Other times, they hit later. The important thing is that we look at the market through the same filter each day. This gives us a consistent routine.
Part of this filtering process is using the Globex overnight range as part of our strategy. For many years, the Globex prices have been very important in terms of trading. They highlight the overnight action and trading outside of the regular 9:30 AM to 4 PM eastern time trading session (also known as the cash session). When the US market closes, the Asian markets open for trading a few hours later, followed then by Europe, and then the United Kingdom. This worldwide trading activity is represented in the range of the Globex and can be influential when the US market opens the next day.
We have always regarded the Globex range as a representation of global sentiment before the US open. With the US market being the final market to open globally, the Globex range can be used as a metering tool, as to whether we will see strength, weakness, or indecision in the coming trading day. Every day we mark off the Globex high and the Globex low before the 9:30 AM open. These numbers are easily recognizable as they will simply be the current high and current low since the new session started.
After the range has been recorded, the concept is simple. We are looking to trap novice traders who are attempting to buy breakouts of the Globex high or sell breakouts of the Globex low. The key is to look for well-structured and prime location supply and demand zones above or below the Globex range for execution. On November 8th, we had two set ups of this kind which we can see below from the screen recording:

The green line represents the Globex High, and the red line represents the Globex low. Take note of how we have supply above the green line and demand just below the red line. These are predefined areas that are attempting to capture amateur traders buying or selling into these areas. Often these trap areas are triggered early in the trading day. However, sometimes they can trigger in the last few hours as well. If they are hit within the regular cash session, they are regarded as traps. These areas did not meet entry until later in the trading day, but as with many solid opportunities, they were worth the wait and patience played its part:

Both setups resulted in generous risk to reward profiles. However, we should draw attention to the size of the areas themselves. The demand zone below the red line offered a tight base with a good move away and a decent risk to reward ratio and was good to go. However, the higher supply zone above the overnight high was too wide for initial consideration and required us to drill down to refine the entry within the initial long wick on the 15-minute chart. We decided to drill down to a smaller timeframe to tighten the entry as we can see below:

In this illustration, you can see how the original 15-minute zone looked, and then how it was refined on the two-minute chart, to highlight the specific basing before the drop. Also, notice how the circled higher supply area was ignored even though the structure was good. This area was ignored because it was not part of the original 15-minute candle structure.
This concept is key. To be consistent in trading we must be consistent in our analysis. If we had decided to pick the smaller separate two-minute zone over the original 15-minute area, we would have deviated from our plan and would have missed the trade. The rule of thumb is to always use the larger time frame zones and drill down. We then need to avoid being distracted by what we see on the smaller time frames. Typically, these areas are more noise than anything else.
As a general takeaway when setting up the Globex trades daily, always begin with the 15-minute areas or higher. Never start on lower timeframes as they are usually less reliable. If you can’t see it on the bigger charts, it is usually not worth noticing. However, if we can drill and refine a larger zone with a smaller chart then we create superior risk to reward potential overall.
TRADING & INVESTING IDEAS
DIS – The Walt Disney Company
The Setup:
Disney has been in a weak-looking range for much of the last quarter and has a chance of re-establishing its range – the current zones offer both buy and sell opportunities.
The Logic:
When stocks are somewhat lacking direction, it makes sense to play both sides of the market, both long and short. Always ensure there are adequate profit zones on such setups.
The Zones
110.77 -114.41 and 124.57 – 127.35

SBUX – Starbucks
The Setup:
SBUX has recovered well from its lows earlier this year and rallied strong. However, we are now approaching Weekly Supply on both the stock itself and the broad market, which could increase pressure on the prices.
The Logic:
Weekly zones are powerful areas to play shorts, especially when backed up by broad market indexes in the same price patterns. Look to play the odds in our favor when this happens.
The Zones:

A More Reliable CCI
Oscillators can be a powerful analysis tool, especially when used with the Pinnacle Method as a decision-support tool. We would never recommend using them alone as a buy or sell signal. However, a great technique to use them would be as a “filter” for when to consider Supply and Demand zones for entry. The standard settings for the CCI (Commodity Channel Index), are 14 periods of data with overbought and oversold signals at +100 and -100. The downside of these settings is that the indicator spends lots of time giving an excessive number of signals, as shown below:

An easy fix is to simply slow things down by adjusting the OB and OS datapoints to +200 and -200. This way there are less signals with greater reliability. These signals can be used as a filter when considering major zones for both buy and sell opportunities. Refer to the example below:

Generally, for indicators, use more data for more reliable signals and to slow things down when used with Supply and Demand zones.
Drilling Down the Entry
The topic of this week’s article is the direct result of numerous questions we have received from members regarding the drawing of their zones. The beauty of the Pinnacle Method is in its simplicity. Supply and Demand will always be the greatest influence on prices. There is nothing more fundamental to price action than this simple yet powerful concept in trading. Highlighting areas of supply and demand, and entering at the greatest extremes of price imbalance, will typically always offer the greatest risk to reward opportunities.
However, it’s possible for the simplest concepts to have subtle nuances too. Wherever there is room for subjectivity, there is also room for error. It is vital that traders remain consistent in their actions and implementation of their trade plan. Typically, we find that most newer students of the Pinnacle Method initially have a hard time clearly defining the zones. Some will draw the basing areas widely, while others will keep these entry areas narrow. Is there a right or wrong way to do it? The answer to that question depends on which results you’re comfortable with: Higher reward-to-risk but less opportunities or lower reward-to-risk but better chances of meeting entries.
For example, if you keep your entry areas narrow with very tight stops, you have the potential to achieve very high risk to reward ratio outcomes. On the flipside, you will likely miss more trades because of a tight and narrow window of opportunity at the trading zone. When using wider areas around price imbalances the opposite is likely to happen. You would likely see more trades triggered and less missed opportunities, however the risk to reward ratio will be far smaller.
Ask yourself what you are comfortable with? Do you get frustrated with missing trades by a few ticks because of your narrow entries? Are you comfortable with being triggered on more opportunities and settling for lower reward ratios? It really depends on the individual. What is most important is to be consistent in whatever you do and measure the results accordingly. Let’s review both scenarios.
In a recent Open Exchange session, we highlighted a demand zone on the Nasdaq futures contract (NQ) which represented all the characteristics we look for when qualifying an opportunity. It had a strong move away, very little basing in the area of the candle clusters and finally, clean price action behind the zone. The trade itself didn’t trigger until the next day, but was a clean entry for a big rally higher, as we can see below:


Draw attention to how the zone itself was drawn. Both candles in the base, before the move away, were used. This is a great technique to use to ensure you capture as much of the zone as possible without getting too tight and missing the trade. Remember to draw the base to include the last candle before the explosive move away.
If we had used the smallest basing candle in the sequence, we would have missed the opportunity:

Like this example, notice how detrimental it would have been to “Drill-Down” to a much smaller chart to highlight the entry. In some cases, it makes sense to refine a zone on a smaller chart, such as to increase the risk to reward outcome. However, this can also lead to a missed entry too, as seen below:

It should also be recognized that if the smaller zone entry would have triggered, an incredible risk to reward ratio would have been produced. However, in this case, you would have missed the entry if you took the smaller zone, and you don’t make anything when you miss an entry.
When drawing entry zones, the most important factor is to be consistent in your process. As said earlier, if you are comfortable with fewer trades, more missed setups, but huge risk to reward trades now and then, that’s great. Stick to it. If missing a trade frustrates you, then give yourself a better chance to get in at the level by widening your entries. Strike a balance in your trade plan and give it a chance to work. Most importantly, repeat the same methodology over and over.
TRADING & INVESTING IDEAS
CSCO – Cisco Systems
The Setup:
Cisco has been building momentum over the last few weeks, creating Demand areas as it pushes higher. Look to buy pullbacks to demand zones to take advantage of the upside potential. The stocks also hit Monthly Demand recently.
The Logic:
The Tech Sector (XLK) had hit major demand which should help stronger tech stocks overall. When prices are moving higher, we look to buy at newly formed Demand zones along the way.
The Zones
49.68 -50.72

CRM – Salesforce
The Setup:
CRM has been making new highs since testing monthly Demand recently and looks to continue. We can reengage the upward momentum as prices potentially move higher.
The Logic:
When individual stocks are showing strength in a generally weaker market, we can increase our probability of success when buying at Demand zones. The zones can also benefit from an overall stronger sector (XLK) and their own higher time-frame zones being hit.
The Zones:

A simple note on Moving Averages
Moving Averages are probably one of the very first Technical Indicators ever created and to this day, they have remained very popular with Traders and Analysists. They can indeed be a useful tool if implemented the correct way and when you avoid relying on them for multiple buy and sell signals. They can be used in a variety of ways, (more of which to be discussed in a future article) and are a great tool to help the decision-making process and to filter trades, ONLY when used with Supply and Demand. At Pinnacle, we have often been asked which is the best Moving Average input of number to use? The answer is simple: It doesn’t really matter. The number itself is irrelevant as price will at some point revert to any numerical mean. What is more important to remember is one simple thing: The larger the data input, the more reliable the Moving Average will be as a support tool, as you can see on the diagram below. Whether it be confirmation of trend or for dynamic Supply or Demand, go with the bigger data input for a better signal.

How To Insure Your Financial Assets
Most people understand the concept of insurance. When you buy insurance, you pay a premium, and you’re buying the right to file a claim if something you own is damaged or destroyed.
The insurance company, in exchange for collecting the premium, is obligated to pay out on the value of the policy.
Having car insurance doesn’t mean you won’t total your car. Having home insurance doesn’t mean your house won’t burn down. All it means is, if your policy is paid in full, and hasn’t expired…you’ll get compensated for the loss. You did lose the asset, but financially you’re made whole.
You get a check! Why do you get a check? Is it because the insurance company likes you, or feels sorry for you? No, you get a check because the insurance company, in exchange for collecting a premium, is obligated to pay out on the claim.

So, if a group of adults were asked- Who has car insurance? Home insurance? Life insurance? Most hands would go up.
However, if those same people were asked- Who has stock insurance, IRA insurance, or even mutual fund insurance? They would have a very baffled look on their faces in response.
Considering that an IRA is probably the largest financial asset most people have (aside from a home, which as mentioned is insured against loss), and you asked someone why they didn’t have stock insurance, you’d probably hear one of the following responses:
- I’ve never heard of it.
- It’s not available.
- It doesn’t exist.
Now don’t go calling State Farm or Allstate and ask for an IRA or stock insurance policy. That doesn’t exist in that capacity.
So, if stock insurance doesn’t exist, how can you protect the value of a financial asset? How can you protect the value of your retirement account or stock portfolio against a crash?
PUT OPTIONS!
When buying a put option, you’re buying the right to sell a stock at a set price, a higher price…regardless of how much the stock drops.
What does that sound like? Insurance!

In this example, AAPL had just announced their quarterly earnings right after the market closed. AAPL just announced one of the most profitable quarters and released one of the best earnings reports in US history.
The stock closed that day before earnings at $130. And yet, within minutes the stock was already down almost $7 and over 5%…on amazing earnings. And to add insult to injury, the stock was down at $90 four weeks later.
Had you held the stock for the next month, you’d be down $40/share and over 30%.
However, what if in advance of the earnings announcement you bought insurance? What if you had purchased a put option? A put option at the $120 strike price.
What exactly did you buy? You bought the right to sell shares of AAPL at $120, no matter how low it goes. So, a month later when AAPL was trading at $90, you still had the right to sell your shares at $120!
You did lose the asset, the stock tanked, but financially you would have been able to recoup all or a large portion of the loss.
And what if the stock didn’t go down? What if the stock went up? Great, you didn’t need the insurance. Having insurance lets you sleep a little better at night knowing you’re protected, but you hope you never need it.
But how many of you hope to file a claim? How many of you are upset your life insurance policy hasn’t kicked in yet this year?!
At the end of the day, it is possible to protect your financial assets as easily as your house, car, boat, wine collection, or any physical asset you own against loss.
Now, when do most people find out they don’t have flood insurance? After the flood. While the concept of putting insurance on your financial assets with put options is an easy concept to grasp, you need to learn the intricacies of options to make sure you bought the right option, at the right strike price, with the right expiration date.
At the Pinnacle Institute, we work with our members to help them understand options. So, if they decide to buy them for investment or protection purposes, they know the right option to buy based on the situation if they choose to.
The Inside and the Outside of Gaps
Price gaps are commonplace in the global equity markets and can occur on a day-to-day basis. In fact, all financial markets can produce price gaps. This includes the Forex markets which are open 24 hours a day, 6 days a week. However, gaps in markets outside of stocks are less frequent and typically only occur over the weekends and at the start of the new trading week. When it comes to the stock market, we have a different scenario with gaps happening almost every day. The fact that the US equity market is only open from 9:30am to 4:00pm EST means that we can expect plenty of decent gap opportunity whenever the opening bell rings.
Depending on market conditions and, of course, the application of the Pinnacle Method, price gaps offer regular trading opportunities throughout the week if rules and processes are followed. Most novice market speculators simply follow the textbook rules of gap trades and nothing more. They usually buy when the market gaps up or sell when the market gaps down. These trades are usually taken for emotional reasons as most market speculators suffer from the fear of missing out.
Let’s face it, gaps up are usually the result of good news and gaps down are usually the result of bad news and people love to chase the action. Often as we know, this leads to losses and poor trading results. To overcome this hurdle, we need to do two simple things: Respect the laws of Supply and Demand (The Pinnacle Method) and remember that not all gaps should be treated the same. Let’s take a deeper look.
As Pinnacle members you should all be somewhat familiar with the terms and concepts of the Novice Gap and the Pro Gap. These two price structures offer great opportunities to enter trades at key Supply and Demand zones that were created with imbalances at the gaps. If you are reading this and are unfamiliar with these concepts, head over to the member dashboard and review the Pinnacle Method Foundation course for more information in the “Know Your Gaps” lesson. With this covered, let us look at gaps from a different perspective, namely the Inside Gap and Outside Gap.
Inside and Outside Gaps are also created on a regular basis and almost daily in the stock market. The terms “Inside” and “Outside” reference where the price gap opened in relation to the previous day’s trading range (the day’s high and low). Look at the example below:


In this example we have two gap downs. The first is an outside gap, because the price opened below the lows of the previous day. The second gap down on the right-hand side of the chart, is an inside gap, because the gap down opened within the previous day’s range.
In this example, pay attention to the first gap. Do you notice how the price gapped down below the previous day’s low and continued to push much lower? Some of you reading this will also notice that this is a novice gap scenario. Price was already trending down and then the market gapped down lower in the direction of the previous trend. Often novice traders chase this kind of price action only to see it reverse against them. However, in this example, the market gapped down and continued to go lower.
We must be cautious of novice gaps when there is a lack of quality supply or demand to stop it in its tracks. Often, we will see the price continue in the direction of the gap as the market forces build momentum. It can be frustrating as a professional trader when you are expecting the reversal on an outside gap day, only to see the market continually move one way. So, the question is how do we deal with them?
The best answer is to simply have patience and wait for the market to show its hand before acting. It’s more probable that we get our fingers burnt when chasing an outside gap by jumping into the apparent momentum only to watch the market reverse out of nowhere. We can avoid this by reading and identifying the newly created Supply or Demand that appears after the outside gap. Here is an example to consider from the previous chart:

Do you notice how after the gaps were created; they then produced a continued movement away from the base? We can describe these areas as Supply Gaps when we have a gap down and a continuation. If we can be patient and wait for the market to retrace to the origin of these gap movements, they offer us minimal risk with a defined entry and clear targets. The biggest challenge is to wait and not chase the price action!
Sometimes Price will pull back to these areas in the first 15 minutes of the open and other times an entry at the area will not be triggered for several days. Either way, these are quality areas for our consideration, as we can see from another recent example:

On this chart we have an example of the demand gap, a scenario where we had an outside gap up on the open and had to wait for price to pull back to the origin of the move for an entry long. The second is a supply gap from a few days ago, which offered an ideal short entry two days after it was created.
We can treat these supply and demand gap areas like we would any other supply or demand zone. The same rules for entry, stop loss, targets can be used. These set-ups can occur in any market but are most prominent in individual stocks and stock index futures. We hope this lesson is helpful to you.
TRADING & INVESTING IDEAS
MRK – Merck and Co.
The Setup:
MRK is trading in a wide range with of longer-term Fair Value. Look to engage in Supply and Demand zones at the extreme of the range itself.
The Logic:
When price is in relative equilibrium, we need to enter trades as far away from the mean as possible. Untested and well-structured zones offer this opportunity.
The Zones
94.37 – 95.35

K – Kellogg’s
The Setup:
Kellogg’s has struggled to find any long-term directional momentum and with this in mind, both long and short plays can be considered.
The Logic:
Like anything else in life, look to always Buy Low (wholesale) and Sell High (retail). This stock has established price extremes at Supply and Demand and these areas are ideal for entries.
The Zones:

A Simple Way to Trade the US Dollar
This year has not been a good one for most long-term investors. Most markets are still lower from the start of the year, and we have been seeing broad sell offs in a variety of commodities and currency pairs as well. One market that has been benefiting is the US Dollar. As you know, we use the US Dollar in the daily Forum as a major probability enhancer and inverse help. However, we have had many questions about how to trade it as a vehicle. While you can trade the dollar index futures, this would require a subscription to a specific exchange that is not suitable for everyone. Therefore, a simple solution would be to trade the EURUSD currency pair. Notice how the Dollar Index chart and EURUSD chart are inverse to one another? When one hits Demand the other will likely be hitting supply and vice versa. This makes the EURUSD an ideal way to engage in trading opportunities on the US Dollar indirectly. Safe trading!

TIME & PRICE
Time and price are a simple relationship most traders and investors think backward. And the backward thinking typically comes from conventional Technical Analysis. When it comes to identifying market turning points, most people look at a price chart and look for areas where there was a lot of trading activity. Thinking that when price revisits that area, it will likely turn and move in the opposite direction. However, if we think the simple logic through, we find that conventional thinking with time and price is completely backward.
Time and Price: The less time price spends at a price level, typically the more out of balance Supply and Demand is. The more time price spends at a price level, typically the less out of balance Supply and Demand is.
Let’s look at the trading opportunity above in which we identified in the DOW by following our Supply and Demand rules. Demand zone “A” is a Demand zone with very little trading in it (very few candles). In other words, price spent very little time at that level before trading higher in a strong fashion. This, along with it being a qualified Demand zone, suggested a large Supply and Demand imbalance. Which means when price revisits the zone, there’s a high probability that it will turn higher. Earlier in the week, price did revisit the Demand zone very briefly, then turned higher and rallied over 1500 points in two trading days. Notice it just barely touched the zone and turned higher. This is because Supply and Demand is extremely out of balance at the zone.
When looking for where price will turn and where it will move to (market timing), think about using simple logic instead of reading all the trading books and watching all the videos that are so readily available. Don’t be afraid to challenge conventional logic. If conventional logic doesn’t make sense, it’s probably wrong.

Who is Benefiting from Your Financial Decisions…You or Wall Street?
With so much volatility and uncertainty in the markets these days, the average investor is either confused or scared. The Stock market has been down much of the year, with many 401k’s riding right down with it. Wall Street professionals seem to be all over the place as well. Some major banks are calling for another 40% drop while others are looking for a 25% rally. Wherever the markets go from here, one outcome is almost certain…the Wall Street professionals’ profits will greatly exceed the average investors, whether the markets go up, down, or sideways.
Making major financial decisions that are truly best for you requires non – conventional thinking. There is a reason why the gap between Wall Street’s annual profits and the average investors’ is so wide. There is a reason why Wall Street revenues break records almost every year, and the average investor hardly ever achieves their financial goals. It’s simply a matter of how both groups think, which leads to the action that drives the results. The Wall Street professional ‘thinks the markets’ vastly different than how the average investor does, for whom Wall Street serves. Wall Street returns may be a big stretch for the average investor, but if you even want to get close you had better start thinking and acting like Wall Street.
Price is the one-word Wall Street doesn’t want you to think or ask about. The reason for this is because just about every financial decision you’re going to make requires you to buy something: Stocks from your broker or financial advisor, Annuities, Mutual Funds, Life Insurance Policies, and more. In all cases, you are essentially buying something from someone which means they are trying to profit from your decision. With Stocks for example, Wall Street owns the stock at a certain price and sells it to you at a higher price. That is one of the many ways they profit, from your purchase of the stock. Don’t blame Wall Street, this is how the system is setup. Instead, realize that the responsibility to make the right decision is on you. The goal is to first become aware of this issue, then understand how to make the right decision, and lastly feel comfortable and confident doing it.
The average investor almost never asks what price they are buying a stock. Make sure you buy it on sale, just like Wall Street does. Wall Street professionals suggest buying and holding, but are they doing that? Wall Street focusses on price more than anything else when buying stocks, bonds, and any financial instrument. The problem with “Buy and Hold” is it really means “Buy at Any Price in the Market and Hold with No Plan for Risk or Profit”. Does this make any sense to you? Do you think this is the strategy financial institutions use for their capital? Wall Street isn’t doing anything wrong; the average investor is. And this is simply because of a lack of understanding. So, it’s time to stop thinking and acting like an average investor and start thinking and acting like the big banks and financial institutions. Understand that how the investor profits in the financial markets is the same as how you profit buying and selling anything in life. Buy at wholesale and sell at retail. The answer is often found when keeping thinking simple.
Managing Expectations at Major Levels
The word “challenging” comes to mind when looking for a simple description of current market conditions. With most assets down and only the US dollar in Bullish mode, we can’t help but feel that the markets are on the tipping point of something major.
There are many moving parts to the fundamentals and as you know, the Pinnacle Method will always use technical price action to determine the ideal trading opportunities and set ups. Usually anything news related is just a distraction. Price itself should always be the primary variable that determines decision making. Yet, major economic news still factors into market behavior, especially around major levels. This is something we could be seeing right now.
We often make the mistake of anticipating market moves without managing our own expectations. This can lead to frustration and poor decision making when trading and investing.
For example, when price is approaching a higher timeframe Supply or Demand level, we often anticipate a major and almost instantaneous reaction from the area. This leads to expectations of a quick and easy profit or leads us to over manage the trade because we expect a fast reaction from the zone.
It is common to see price spending more time at these major areas in the form of sideways and ranging action. This can lead us to think that the zone is not working. When, what we are often witnessing are the dynamics of either accumulation or distribution.
Understanding this concept can help us with our patience and managing our expectations. Accumulation represents major buying activity at a key area and Distribution represents major selling activity at a key area. Since major institutions trade large size, accumulation and distribution at higher timeframe zones can be a lengthy process.
Think about how many different orders are likely to reside in a weekly or monthly zone. With multiple price levels in a higher timeframe supply or demand area, a large bank or institution has the opportunity to get their orders filled with higher probability. Let’s look to some recent major zones on the SPY. Firstly, this weekly Supply zone:


This area was created late 2021 and was then revisited for the first time in early 2022. On this weekly chart, it looks like price literally touched the zone and dropped immediately. Yet when we zoom down to a daily chart, we see a very different picture:

Draw your attention to the first time the market came close to the 461.67 line. There was a double top which represents secondary evidence. This suggests an abundance of supply in the area. The market then dropped to about 400 before rallying back in late March to test the proximal line.
This near $50 region represents an overall distribution phase at a major market area and gave multiple opportunities for the institutional players to offload positions. This weekly area was tested almost 3 times before the true drop happened. I am sure that many market speculators were expecting the major sell off to happen when the price first came into the zone at the end of January. When the market re-tested the area in late March, there were likely many bullish hopefuls expecting a breakout, yet the market did the opposite.
We could be seeing this again as the markets are trading at major monthly levels on the stock indices. Currently the ES and SPY are testing monthly Demand:

Clearly this monthly zone was holding a lot of residual buy orders as we saw around a 50% retracement from the area last month. Now we are testing the area once again and the question is are we seeing major distribution or accumulation? Either way we should anticipate choppy and ranging conditions until the market clearly shows us its next move. We can see evidence of this on the current daily charts:

Of course, none of us have a crystal ball and no one truly knows where the market will go to next. Everything we do here at Pinnacle Institute is based upon probabilities and rules. However, understanding the concepts of accumulation and distribution can help the temporal nerves during these critical phases of price action.
Knowing what to expect can have a positive effect on our trading activities. It may make sense to simply sit out of the market until we get a clear signal to the up or downside. Or we may feel like playing the current range until the market breaks out higher or lower. The choice is up to us but knowing and understanding this dynamic will always keep our expectations in check.
TRADING & INVESTING IDEAS
TSLA – Tesla
The Setup:
Tesla has been one of the better performing stocks over the summer and is showing greater strength than the wider market itself. We are in a state of Fair Value right now with untested zones waiting above and below the range.
The Logic:
When stocks are in relative equilibrium (Fair Value) it makes sense to look for Supply and Demand zones outside of this range which offer the greatest risk to reward potential.
The Zones

CVS – CVS Pharmacy Stores
The Setup:
CVS has not sold off to the degree of the wider market and benefitted from the brief market rally we saw over the early summer. As we approach broad market demand, we can look to buy CVS at larger timeframe levels too.
The Logic:
When individual stocks are showing strength in a generally weaker market, we can increase our probability of success when buying at demand zones. The zones can benefit from an overall stronger broad market if the stock itself is also showing strength.
The Zones:

Getting Out before The Rest
Price Gaps are by far one of the most popular zone structures we look for here at Pinnacle Institute. Using both pro and novice gap zone structures for entries and exits can be a consistent way to approach the market when scanning for opportunity. We would never blindly short a gap up or buy a gap down like the textbooks tell us. Rather, we choose to use our levels to enter precisely and with rules to follow.
However, it should be noted, that we still need to be objective and mindful about profit taking when trading gaps. In the below example from a recent Open Exchange session, we took a short at supply with the target of the unfilled gap below on the ES. While the origin of the gap up at 3666.75 was the ideal target on the short (and was achieved), it doesn’t hurt to have intermediate targets as well. Try to keep things simple and target a 50% gap fill as the first target. 50% of the gap fill is often achieved as it represents equilibrium. With a little back testing, you will see that sometimes gaps hit 50% and then reverse, making this an ideal achievable target on the way to the larger profit of the gap fill itself.

Time Is Money
When most people hear the phrase ‘time is money’, they think of their job…and literally trading time for money.
It is a negative association in which they must use their time to earn money. They must sacrifice their time to go to a job they may or may not enjoy, to earn a salary to live.
What if we could turn this concept around? Take a negative and make it a positive. What if we could TRADE money for time?
What if we could actually sell time to make money?
So why do people trade and/or invest? To make money, right, to make a profit. As we all know, there are no guarantees in the financial markets. Bullish trades can drop, and bearish trades can go up. Any trade can go against us for any reason, regardless of what the chart looks like.
While there is no guarantee of making a profit in the markets, and there is no guarantee a stock will get to a profit target, there is one guarantee we can make: Time will pass.

The stock might not move, or it might move in the wrong direction. But we know the calendar will always move forward. Options have two things no other investment has…an expiration date and extrinsic value.
Options are the only asset that can be traded for more or less than its intrinsic value. If a stock is trading at $75 per share, that is the price a buyer will pay or a seller will ask for. No one will offer to buy it for more than $75, or look to sell it for less than $75.
The stock price is the stock price. But because options have an expiration date, we are not just trading the intrinsic value of the option which is based on the price of the underlying stock…we are also trading the time value those options have until their expiration date.
We are actually buying and selling time when we trade options.
If a stock has no intrinsic value, you can not trade it. You can not buy or sell a stock that is “trading” at zero. You can not trade a stock that is worthless. However with options, while some will have no intrinsic value, every option will have time value. As every option has an expiration date, every option premium has value even if it is only the time value until it expires.
And there is a guarantee the option will expire. There is no guarantee the stock price will even move, but there is a guarantee that the expiration date will arrive. As time dissipates, so will the option’s time value that we sold. It will be zero at expiration.
The option may or may not have intrinsic value based on the trade, whether we are right or wrong directionally, but the time value will always be zero at expiration.
And that is a guarantee!
So with the guarantee that the expiration date will arrive, if we sell what are called “out of the money” options (options that have no intrinsic value), these options will be worthless at expiration as long as they stay out of the money.
Simple options credit spreads (Bull/Put & Bear/Call Spreads, as well as Iron Condors) are considered non directional trades, in that we do not need the stock to move to a profit target at an opposing zone.
We will buy and sell “out of the money options”, collect premium, and as long as those options stay out of the money they will expire worthless. And we will get to keep all or part of the premium collected on the trade entry.
We will profit not on the stock movement, which most traders are used to doing and need to happen to profit, we will profit simply on the calendar movement.
These non directional trades are trades where we do not have to be right to profit. We can even be somewhat wrong… just not really wrong!
Directional traders use the Pinnacle Method to identify demand and supply zones. They enter bullish trades at demand, and bearish trades at supply. They look for the demand zone to be a springboard for a bullish bounce away from the zone, or the supply zone to be a back stop where a stock will stop rising.
Using the Pinnacle Method to identify supply and demand zones where we believe down trending stocks will stop dropping, or rising stocks will stop rising, we can sell out of the money option premium. And as long as the directional trader does not get stopped out, the non-directional trader will profit.
The directional trader needs the stock to move, the non-directional trader does not need the stock to move. The only thing the non-directional trader needs is to not get stopped out…while the calendar is guaranteed to move.
Below is an example of a Bull/Put spread trade posted in the Options Exchange this week:

The trade is a Sept 30th 235/230 Bull/Put spread. As the stock is sitting at $240, and the distal line of the demand zone is at $23- the trade will profit simply if the stock closes at or above $235 by next Friday (in ten days). And as $235 is below the distal line of the zone, as long as MSFT stays at or above the demand area, the options will expire worthless.
Both options, the 235 Put we sold and the 230 Put we bought, are below the current stock price. They are out of the money, they have no intrinsic value, and they will expire worthless if the stock closes over $235 on Sept 30th. Now of course there is no guarantee the stock will be over $235 next week at expiration. However, as the stock is already over $235, nothing has to happen for it to stay over $235.
As long as the zone holds, by selling out of the money options – by selling time, we do not need the stock to go up. We just need it to not go down. While the directional trader needs the stock to rally to make a profit.
And while we do not know where MSFT will be on Sept 30th, we are guaranteed that Sept 30th will arrive.
Selling time to make money. What a concept!
Process Above Everything Else
Over the last week or so, it has been virtually impossible to ignore the events and coverage surrounding the death of her Majesty Queen Elizabeth II. Whether you turn on the TV, read a newspaper, listen to the radio or simply search online, pictures and reports of this historical time are dominant everywhere. From ceremonies proclaiming the new King to cathedral services in honor of the former Monarch, one thing has been apparent throughout. There has been immaculate consistency and planning every step of the way. Clearly, there has been a process behind every speech, march, or service we have seen. So, what does this have to do with trading and investing?
Perception is Key
Consistency and process always take precedence over anything else, regardless of your style or strategy when trading and investing in today’s market. Whether it be the process of controlling loss, executing our strategy, or just managing a trade, there must be structure behind everything we do. Failure to implement this simply stacks the odds of success against us.
Many novice traders make the mistake of thinking that trading success simply boils down to a great strategy. Of course, strategy is key but there are many ways to implement a strategy. To us, this is where the process becomes fundamental in the day-to-day execution of any strategy. Unfortunately, many are unaware or simply don’t understand why the process is so important. Let us explain this concept in more detail.

There is no such thing as a simple out-of-the-box routine in trading. A common issue we see when teaching novice traders our strategy, is how they then go on to implement the strategy without adjusting it as the markets go up, down, and sideways. Sometimes the conditions are volatile and other times they are not. While a great strategy should be suitable for most market conditions, having a solid process behind adapting the strategy is key. This allows the strategy to thrive in most market conditions and helps us get closer to the results we are hoping to achieve.
Think about it like this. The Pinnacle Method can be used as a strategy for all styles of market speculation, be it day trading, swing trading, or position trading. Supply Zones and Demand Zones appear on all charts; however, there still needs to be a process behind using the Zones in line with the results we are hoping to achieve. Simply put, our goals as a day trader need to be realistic with profit taking and trade management. Short-term movements are far more challenging to manage than long-term movements associated with swing and position trading. Failure to recognize this can result in having a great strategy that doesn’t yield the results we were hoping for.
Think about how many times you may have had a profitable day trade that looked like it was going to move further in profit, only to turn around and stop you out. Or how about getting into a solid swing trade setup such as taking a conservative three-to-one profit, only to watch it continue to run to a 10-to-1 trade or beyond? Building your process behind the strategy is one way we can help to solve this problem.
During our Open Exchange sessions we tend to focus on smaller first targets, which allow us to get safe and get paid more aggressively. However, in our Close Exchange sessions, which focus more on medium to long-term trades, our trade management process gives us more room to breathe as we look for bigger targets and runners. The Pinnacle Method is applied consistently across all sessions, yet the trade management process is different depending upon the style of trading and the results we are hoping to accomplish.
Let’s look at the current chart of the ES Futures below. In this example, we can see how understanding the short-term and long-term chart relationships can set the expectations for our trades. We can see Supply which we have recently fallen from, and how we have just triggered daily Demand, which Price is currently respecting.

The daily chart showed us when the 4148 Supply was triggered, it had the potential to go down to 3930. As a swing or position trader, if we would have shorted here, it would have been fair to expect a decent profit target at the opposing Demand Zone. Likewise if getting long around the 3930 Demand area, we could expect a decent profit target potential to around 4100. As swing traders, our process should include this kind of analysis.
However, as day traders this daily outlook could have affected our trade management process in a very different way. For example, look at the 15-minute chart of the ES below.

As a day trader, if you would have shorted the market at the 3978 area shown in the above example, your process should have recognized that the lower demand zone on the 15-minute chart was also located in a daily area. How does this impact our decision-making process? Well, short trades taken nearer to daily Demand should have smaller profit targets and more aggressive trade management. The demand zone shown at 3930 has far greater profit potential because it is also located in a daily demand area.
Too many traders apply strategy to one chart but ignore the process of analyzing the larger time frames too. Therefore, as a day trader, knowing we are getting closer to a higher timeframe zone should always make profit targets smaller and more realistic. Conversely, when taking zones located near to bigger time frame turning points, we can be looser and more ambitious with our profits and management.
The lesson is to adapt our trade management and profit-taking process to the style of trading we are executing. This sets our expectations objectively when managing the trade and helps us to be more realistic with our targets. Blending strategy with process is a powerful way to complement these two different aspects of market speculation.
TRADING & INVESTING IDEAS
EUR/JPY – Euro vs. Japanese Yen
The Setup:
This currency pair has finally reached Monthly Supply and is beginning to see selling pressure. Looking to short at newly formed Supply.
The Logic:
The Lowest Risk and Highest potential reward will always be found after major trending periods. Now we are at monthly Supply, and weakness is beginning to show; this is an excellent opportunity for a low-risk short.
The Zones

HG – Copper Futures
The Setup:
Copper is in a long-term state of fair value, offering opportunities at both extreme Supply and extreme Demand. Therefore, both Long and Short opportunities can be considered, with the middle of the range as the first target.
The Logic:
When markets are ranging and in fair value, it always makes sense to go to the farther out Supply and Demand areas. Copper is showing a ranging pattern in line with the indecision in the broad market. These two assets have some degree of correlation.
The Zones:
Objective Trade Management
Following up on our earlier article regarding processing trade management, we would like to share a simple tip using a popular technical analysis tool: the Moving Average. Here at the Pinnacle Institute, we feel there is nothing more important than recognizing Supply and Demand zones for our trading opportunities. Everything else pales in comparison, especially conventional technical analysis strategies. However, that doesn’t mean that every technical tool is redundant. The Moving Average is a powerful tool if used in the correct way. We always encourage our members to be objective in everything they do. As we know, trade management can be a challenge. A simple technique to take the emotion away when letting our trades run is to use the MA. In the example below, we can see a 20-period MA trailing price after a previous supply zone we highlighted in the Close Exchange was triggered on AAPL. When entering short trades, wait for Price to get below the moving average and then use the moving average for a trailing stop. We can place a stop loss just above the moving average when short or place a stop loss just below the moving average when long. This way, we do not have to wait for new levels to form in order to trail our stops. There is also the added advantage of getting closer to the price action when the market does retrace. We hope this is helpful.

Dealing With Market Losses
It is well known that the majority of active traders are not profitable. To be clear, the majority of active traders lose money. In addition to that, the few traders who are profitable have losses as well, though they come out ahead in the end. It’s safe to say that if you’re going to be involved in self-directed trading, you will experience losses and must deal with them. Losing is a very necessary part of winning in the trading world. However, for most people losing leads to fear, and fear can be paralyzing when it comes to proper execution of rules.
Perception is Key
Consider some setbacks and losses you have had in other parts of your life such as financial, relationships, and career. Most often they make us stronger and lead to something better. The key to growing from these is the ability to be able to compartmentalize them. If we perceive each trading loss as ‘losing’, it will have a very negative feeling and create set backs. Yet if we put each trading loss in its proper place, which is in the ‘necessary to win’ category, a trading loss is then realized as being a key for success. When you adjust your perspective and understand that a loss is always going to be part of a winning strategy, you will have less of a tendency to beat yourself up or think you did something wrong, which often leads to becoming paralyzed by fear and failure. It will likely become easier for you to execute your trading plan like a robot, which is key. From our experience, the rules that truly stack the odds in your favor are not that difficult. It’s the mindset that allows someone to execute with precision, and taking on too much risk is the hardest part. Losing in trading is fine, as long as it’s proper losing. To become a professional winner, you have to first become a professional loser. This is a road block that challenges many, which is why many people fail at trading and investing. To change, you must first start with changing your perception of loss, and learn to become really good at it.8

TRADING & INVESTING IDEAS
AMZN – Amazon.com Inc.
The Setup:
AMZN has rallied and is in between a qualified Supply and Demand Zone.
The Logic:
Price always spends most of its time in between Supply and Demand Zones. Competition to buy at Demand and sell at Supply pushes price back to the middle.
The Zones

IWM – Russell ETF
The Setup:
IWM has rallied and left a foot print of Demand below. The Supply Zone is higher, offering a good Profit Zone.
The Logic:
The larger the Profit Zone, typically the higher the probability of price turning and moving through the Profit Zone.
The Zones:
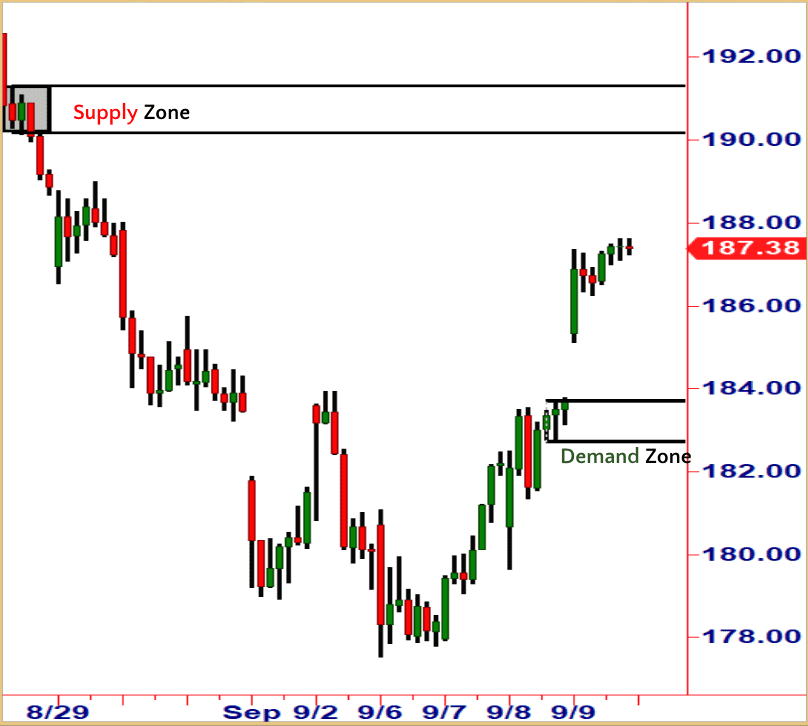
TLT – 20 Year Bond ETF
The Setup:
TLT has declined and is nearing a larger time frame Demand Zone that it has not been to in many years.
The Logic:
When price reaches Supply or Demand Zones from far in the past, this typically means price is far from relative balance suggesting a turn in price is likely.
The Zones:

Zone on Zone
Many years ago when our original Supply and Demand strategy was created, it was all from direct observation of what was happening with price movement in the markets, with no emotion involved- hence our saying “trade what is real, not what you feel”. On the trade desk there were stacks of buy and sell orders, and the price levels with the largest Supply and Demand imbalance was where price was most likely to turn. Identifying this on a price chart was key in developing the strategy.

Notice the Demand Zone from this week’s trading in the NASDAQ from our live trading session. It is actually two Demand Zones on top of each other. Now think back to the trade desk. Instead of one big stack of buy orders, there are two right on top of each other. This suggests that the probability of price turning at that level is higher than if there was just one. So look for zones on top of each other to find higher probability market turning points.
A Logical Approach To Top-Down Analysis
During our ongoing Close Exchange sessions, we are always looking to scan the market effectively to find major Supply and Demand imbalances. When it comes to day trading, it makes sense to focus on one or two assets or products. Fewer markets to look at usually equates to a more consistent analysis. Looking at too much during fast-paced intraday moves can lead to confusion and poor judgment. Therefore, the less is more approach to day trading will always be our preferred method.
However, in terms of swing position trading, it can be more favorable to widen our scope and look for some truly unique opportunities. Doing this though, can often present its own set of challenges. For example, there are literally thousands of stocks that we can trade, so where do we begin? “How do you know which stock to trade?” is one of the most common questions that our Market Specialist team is asked. When faced with so much choice in the financial markets, it is a valid question.
The Pinnacle Method of recognizing Supply and Demand imbalances is based upon rules and objectivity. Trading should always be simple with an easy plan to follow. Our first step to qualifying a Zone should always be based around identifying quality structure and optimum location. Once this has been established, we can start to build the probabilities in our favor with further supplementary evidence. As you know from The Forum sessions every day at 8:15 AM Eastern time, our team often uses the power of inverse markets to help stack the odds in our favor when finding quality trading opportunities. This same powerful logic can also be applied when looking for individual stocks to trade. In this case, we can employ the use of Top-Down Analysis.

Novice investors and traders typically only look at individual stocks. They rarely consider what the broader market is doing when they choose to buy or sell. As we know, the major market indexes have a huge impact on the individual stocks. We can take this one step further by also embracing quality analysis on individual sectors too. For example, if we consider buying a stock, it makes sense to make sure that we buy a stock with the probabilities on its side. To carry this analysis out effectively, we should consider the following three questions:
-
Where is the Major Broad Market (SPY) right now?
-
Where is the relevant Sector trading?
-
Are we planning to trade a weak or strong stock in this sector?
To expand upon these questions, think about it from this perspective. If we were looking to buy a stock, we would like to see the broader market strong and ideally at or near Demand. We should also ideally see the sector to which the stock belongs performing well and at or near Demand. Finally, it would make sense to select a strong stock that has a good chance of rallying in a strong, broad market and sector. This same logic can be applied in reverse for shorting opportunities, i.e., a weak broad market with a weak sector and a weak stock.

Having shown strength over the last few months, the SPY could be an excellent opportunity to buy a pullback at this weekly Demand area. Next, we would like to see a strong performing individual sector. In this case, we can look to the XLF financial sector ETF:

Notice how the chart of XLF is very similar to the SPY chart? This is the ideal scenario where we can see both the broad market and the sector at key levels at the same time. Finally, we can look for an individual stock within the financial sector that is also at Demand. In this case, we found Capital One (COF), which was also at Demand itself:

Having gone through this approach, it makes sense then to do the initial structure and location analysis on the Demand Zone of COF. If it meets the criteria of the Pinnacle Method, then the trade gets the green light, and we can go ahead and place our entry stop and target accordingly. At the time of writing, we don’t know the outcome of this trade. COF may rally, or it may stop out. However, an objective top-down analysis has been carried out, and we attempted to stack the probabilities on our side before taking any trade whatsoever. The fact we have higher timeframe Weekly Zones on the broad market and sector, only helps the chances of the daily chart Demand Zone working on COF.
This kind of analysis can be confusing at first. Still, we can gain a big advantage by taking the same Pinnacle Methodology and applying it to top-down analysis if we choose to take the time and be objective.
TRADING & INVESTING IDEAS
EUR/GBP – Euro vs. British Pound
The Setup:
This currency pair has been in a long-term state of Fair Value. Expect this to continue with uncertain seen currency markets, offering us equal opportunities on both the long and short side.
The Logic:
When Fair Value is in play, it makes sense to look to extreme untested areas of Wholesale (Demand) and Retail (Supply) pricing imbalances.
The Zones

DIS – The Walt Disney Company
The Setup:
After some longer-term weakness, Disney is finally beginning to show some strength after making new weekly highs and may prosper from a Broad Market bounce.
The Logic:
When markets are showing strength, we should look to buy pullbacks to fresh Demand Zones where possible. Current Weekly Demand offers a decent Option Play to sell premium or buy calls OTM.
The Zones:

Use Caution when on The Range
Traders and investors typically dream of long-running trends, but the reality is quite different. While we all love to play strong markets to the upside and lean on the shorts when the markets are selling off heavily, it is easy to forget that markets often enter a range-bound state of Fair Value more frequently than we realize. Recognizing Fair Value is a powerful tool in any disciplined trader’s arsenal and can offer optimum profit-taking possibilities. However, we should not be afraid to play the range inside Fair Value from time to time. A simple tip is to play the extremes when markets are ranging. Avoid being tempted to play the inner Supply and Demand Zones and instead focus on the outer edges. Yes, you will have to wait longer for your setups, yet the risk to reward will always be more favorable in the long run. Look to the chart example below of EBAY for an ideal illustration of how to look for Supply and Demand Zones outside of a Fair Value range.

OPTIONS Discovery
Here at Pinnacle, we constantly strive to not only meet our members’ needs, but equally expose you to other trading and investing opportunities available that you may be unaware of, or that you may want to reconsider.
Perhaps you are doing well in your trading & investing, but perhaps you’re not or not doing as well as you would like. Is it time to think differently? Maybe it’s time to consider a different or additional asset to add to your arsenal of financial opportunity tools.
If you were to ask people about options, the most common answers would likely be:
- Options are risky.
- Options are the riskiest asset class.
- Options are the hardest asset class to trade.
Do options have risk? Of course they do, as with any asset you face the risk of taking a loss. There is no such thing as a guaranteed trade or investment. If there were guaranteed trades…would any of us be here?!
Every asset has risk and any trade can go against you for any reason. So why do options have the reputation of being the “riskiest” asset to trade?

Simple. Because people don’t know what they don’t know.
The majority of options expire worthless. And to most people, if something expires worthless…it’s a bad thing.
But is it?
Many of us at Pinnacle think options are the greatest thing ever invented, and it’s because there are two things options have that other asset classes don’t: expiration dates and time value.
Options give you, well…options.
Options give you a better probability of making a profit, and minimizing a loss. This is because when you’re trading options you don’t need the stock to move, you only need the clock to move.
Stock, futures or forex trades- whether you’re long or short, bullish or bearish, you need to be right on the expected direction you think the asset will go. If you’re right on the direction then you profit, and if you’re wrong on the direction, you take a loss.
Makes sense, right?
Did you know that options are the only asset where you can be wrong directionally, and still make a profit? Options are the only tradable asset where you can enter a bullish trade and the asset can go down, or enter a bearish trade and the asset can go up…and you can still make a profit!
Probably doesn’t make sense, right? Stop and think about it to let that concept sink in.
You can be wrong directionally and still profit, you just can’t be really wrong. You can’t be Enron wrong, and you can’t be going out of business wrong. But if you’re finding that you are that wrong on the direction, it would be best to go back to the basics of our Pinnacle Method strategy, because you’re going to be losing money in any of the asset classes in that case.
Do you like the concept of being ‘somewhat’ wrong and still having the ability to make a profit? Directional traders need an asset to move, and as we mentioned above, in options you do not. You only need the clock to move.
Do you like the concept of being ‘somewhat’ wrong and still having the ability to make a profit? Directional traders need an asset to move, and as we mentioned above, in options you do not. You only need the clock to move.
While we don’t know where a stock will be at any date in the future, we do know when a specific expiration date is. And that’s the closest thing to any type of guarantee that you’re going to get in trading, and it’s only applicable with options…the expiration date always arrives, because time stops for no one.
With options we’re not only trading directionally or looking for an intrinsic profit. We are trading time up to an expiration date.
We’ve all heard the phrase, “If something seems to good to be true…it usually is.” Well, options are the exception to this.
Here are more compelling reasons that make options worth learning and trading:
- Profit off of a stock for a fraction of what it would cost to own the shares.
- Profit off a stocks’ movement without having to own the shares.
- Profit off a stock with as little as $5 or $10 maximum risk if you’re wrong, even if the stock goes to zero…regardless of how expensive the stock is.
- Get paid to buy the stocks you want to buy, at the price you want to buy them.
- Get paid to sell the stocks you want to sell, at the price you want to sell them…for a premium.
- Use options to insure your stock positions against loss, even an IRA or retirement account.
We will be covering these options topics and more in future Pinnacle Pointers Newsletters, and you can also join Steve Moses in the Arena on Mondays at 5pm (EST) where he hosts the session: ‘Everything you Always Wanted to Know About Options but Were Afraid to Ask’.
We hope we have intrigued you to want to learn more about options, and hope you enjoy them as much as we do.
Learning from Earnings

Always Trust What The Chart Tells You…
No matter the time of year, the asset we are trading, or the specific news itself, everything we need is shown to us on a price chart. In our community, we often preach the only truth is the price and how the price moves. Imbalances between Supply and Demand (major buy and sell orders) are what create turning points. This is a fact. There will always be reasons why these imbalances were created in the first place. However, the result remains the same: Prices will rally from Demand, and prices will fall from Supply. When we factor in the complexities of news and earnings data around this, it can be hard to simply follow the price, but less will always be more when trying to be objective in our decision-making process. Let’s take this principle a little further with two recent examples.
The first example is from SIX (Six Flags) and their earnings announcement from August 11th 2022. Their figures came in less than expected:


Notice how the Demand Zone created a strong move away in price that went on to develop serious momentum to make new highs? Price also spent very little time in the area of the imbalance and created a major anchor for price. After the earnings release, price gapped down right back to our established area and rallied to the unfilled gap above:


In both examples that we have examined, there could be several ‘reasons’ why the earnings data caused price rallies in both stocks, even though the figures were far from positive. This is a common reason why so many novice speculators never gain consistency in their trading and investing. They want answers to the wrong questions. If you don’t know the right questions to ask, you are unlikely to discover the ‘truth’ behind the curtain. Always act on what you see and not what you think. We hope this was helpful.
TRADING & INVESTING IDEAS
AUDUSD – Australian Dollar vs US Dollar
The Setup:
The currency pair has been in a state or Fair Value lately, offering both buy and sell trades.
The Logic:
When Fair Value is present, we can consider both directions to trade. Always use the untested Zones when in Fair Value.
The Zones

MSFT – Microsoft
The Setup:
MSFT is showing strength after rallying from Monthly Demand. We can buy pullbacks with targets at higher Supply.
The Logic:
Use Demand Zones to buy pullbacks in strong markets. Unfilled Gaps always offer objective profit targets and trade entries.
The Zones:

Avoid Missing the Gap…
Gaps can be powerful areas of imbalance and are useful for both entries and targets. However, a common mistake we see is when traders get too tight on their entries when using gaps for trade opportunities. A good habit to pick up is to use the entire candle body for your gap entry on the chart being used for trading. This means the Proximal and Distal lines must include both wick high and wick low, as well as the entire candle body. Below are a couple of examples of how this is done. By using this technique, the risk may be slightly greater, but the chances of missing the trade are also decreased. Good for those of us who don’t like missing a wining trade.


Think Before You Buy
Sam Seiden started his career in the financial markets on the trading floor of the Chicago Mercantile Exchange. These are the two most important concepts he learned:
1. How and why price turns and moves in the markets –
The movement of price in any and all markets is a function of an ongoing relationship between Supply and Demand. When this simple and straight forward relationship is out of balance, opportunities are present.
2. How money is really made and lost in markets –
Typically, through gains and losses, novice (retail) trader accounts would slowly be transferred into institution accounts, market maker accounts, and so on. Those who know what they are doing get paid from those who do not.
When markets would decline to price levels where the financial institutions were buying (Demand), novice traders and investors would typically sell because of the decline in price (downtrend) and the bad news that typically accompanies price declines. Institutions would buy at demand, novice traders would sell, price would then rally, and the account transfer was underway.
Then, as price began to rally, good news and the uptrend mentality would cause more buying which then perpetuated a continued rally in price until it reached a level where the institutions were selling (Supply). By this point, the buying bandwagon was in full force drawing in most novice traders to the buy side, right into institutional supply. As soon as the last novice buyer bought from an institution at the supply level, price would decline, and the account transfer was complete. This was his experience during his time working for a firm on the trading floor where his job was to facilitate order flow.
As the trading floor was replaced by electronic trading, you might think that the playing field would level out and the gap between the novice trader and professional traders’ performance would have narrowed. But what actually happened was the opposite. The group of consistently losing traders exponentially increased thanks to the new marketplace being much larger than the exchange ever was, as well as social media and internet influence.
The internet has been the greatest gift for professional traders, and has equally created the biggest challenges for novice traders. Let’s use Twitter as an example:
Joe Trader tweets to his 100,000 followers that he just found an amazing opportunity and bought a stock. For him, it was a good opportunity. However, each buyer after him on his huge chain of followers is simply paying those in the chain that bought before them. For those who know how to buy low and sell high in a market, they love the followers. But it doesn’t work out well for those buyers who bought late in the chain.
Social Media is great for many things, but a trader who uses it as their primary source of information to compete in the markets is typically in big trouble. What determines whether you achieve success from trading and investing is not faster access to information and more education, it is receiving the proper information and education that yields positive results.
Open your eyes to what is happening right in front of you on your trading screens and the charts every day, week, month, and year. Pay attention to the simple concept of how you make money buying and selling anything. Think about it – when you are at the grocery store, when you buy a car, or any time you make purchasing decisions, aren’t you looking to buy at the lowest price possible? That is all the astute trader and investor is doing. Apply that same logic in the financial markets and you may quickly have an edge that most traders and investors never realize.
TRADING & INVESTING IDEAS
BAC – Bank of America
The Setup:
BAC has just developed a Demand Zone below current price. The profit zone should be ideal when price reaches this Demand Zone.
The Logic:
When a Demand Zone develops after a large decline in price, this is a sign that the trend is going to change and offers us an entry before the next trend gets underway.
The Zones

QQQ – NASDAQ ETF
The Setup:
QQQ has rallied from our weekly Demand Zone and is nearing Supply. We also have a new Demand Zone below.
The Logic:
Notice the distance from Supply to Demand. The large Profit Zone suggests these are higher probability Zones.
The Zones:

COST – Costco
The Setup:
COST has rallied and is nearing a Supply Zone. Larger time frame Demand is much lower and the sector is showing weakness.
The Logic:
Notice price has been trading just below the Supply Zone. This suggests a large Supply and Demand imbalance at the Supply Zone.
The Zones:

Location, Location, Location
We have heard this term many times regarding the real estate market, it’s all about location. When it comes to predicting where market prices are likely to turn and where they are likely to move to, what many don’t realize is that location is just as relevant in the trading/financial markets.
Fair Value (the middle) is where the majority of buyers and sellers agree to buy and sell- so that is where there is the most trading volume. This happens because there is a lack of a significant Supply and Demand imbalance.

Supply is a price level where Supply exceeds Demand. Competition to sell at Supply forces price to turn and move lower, back to Fair Value. This is because the Supply and Demand imbalance at Supply is very big.
Demand is a price level where Demand exceeds Supply. Competition to buy at Demand forces price to turn and move higher, back to Fair Value. This is because the Supply and Demand imbalance at Demand is very big.
Keep in mind, price charts represent actual trading (filled orders), not potential trading (unfilled orders). So, while many think price charts show us what we need to see, they actually show us the opposite picture of what we need to see as a Supply and Demand imbalance is what causes price to turn. Our proprietary Supply and Demand strategy is designed with this in mind.
We don’t want to buy and sell in Fair Value; the lack of imbalance makes it very hard to determine where price is going to turn or where it’s going to move to. We want to identify our Supply and Demand zones OUTSIDE of Fair Value as the diagram above illustrates. Price is most likely to turn at price levels where Supply and Demand are out of balance. After all, why would the location concept be different with trading and real estate? They are both just markets with different products.
Now is Always the Best Time to Start
The summer is well underway, and August has begun. As the new month begins, what better time to look back, check-in, and reassess our goals? Typically, the month of August is usually light in trading volatility and volume. This makes it an ideal time to track our results and check in with our plan. Getting caught up in the day-to-day ups and downs of trading is easy. We get excited when things are going well and get down on ourselves when things take a downturn. However, as we know, consistency is probably one of the most important aspects of any trading and investing strategy. The problem is that it’s impossible to be consistent if we don’t make an effort to track our actions and reassess our goals regularly.
Let’s face it, when we have a winning trade, we are more caught up in the excitement of the gain than focused on looking at what we did right and what we did wrong. It’s easy to assume that we are being disciplined and following a plan when everything keeps working in our favor. As the old saying goes, even the blind squirrel finds a nut from time to time! Lady luck shines a light on everyone now and then, and it can be foolhardy to assume that every success we have was purely due to our own skill set and actions.
On the flip side, when things are not going as planned, we often recklessly dive into trades and click buttons without thought, purely out of frustration and desire to get revenge for our losses. For this reason, too many people assume that trading is more of an active participation than a passive one. As we know, trading more and with a higher frequency rarely leads to better results. Waiting for quality setups outside of Fair Value, with solid structure and location, tend always to be the better opportunities.

The Work behind the Scenes is often the most Important Work…
Consider the work that will lead to consistency: screenshots and journaling of your trade setups and keeping track of your actions on a regular basis. Much like filming a Hollywood blockbuster, when watching on the big screen, the audience only sees the final production. However, the work behind the scenes and off-camera allowed the magic to happen during the whole filming process. The same dynamic should be appreciated when considering our work away from the screen in preparation for our work when trading the markets themselves.
With all of this in mind, here are our Top 5 suggestions to help keep you on track for consistency. Remember we are not encouraging a complete overhaul of your trade plan. Rather this is a suggestion to make sure you’re sticking to your trade plan itself. This month, consider doing the following:
- Record the times of the day or even the times of the week when you had most of your successful trades. Also, consider at what time of day you had your worst losing streaks. It’s easy to get chopped up in the trading open as a day trader. Finding quality swing trades can also be challenging towards the end of the trading week. Make a note of this and see what you can learn.
- Consider your emotional state. Being in a good mood or bad mood can have a significant impact on your trade results. Did you have a sense of needing to prove something on that morning you got reckless? Maybe you were feeling nervous about executing your trade plan because of coming off of a losing streak? Always make sure you are in a good mental headspace before getting to the screen and record your mood ahead of time so you can look back.
- It may be simple but get in the habit of taking screenshots of your trade set-ups before and after. It’s amazing what we see and what we don’t see in the heat of battle. How many times have we gone through the “coulda woulda shoulda?” A simple screenshot can help us to see clearer after the event and help us take that clarity to the next event.
- Record how you managed your stop loss during the trade. Simple as it sounds, this is vital. By recording how you managed your protective stop order, you will see if you trailed your trade too aggressively or went to breakeven prematurely and cost yourself a monster-winning trade. Micromanaging a trade has been the kiss of death for many a trader.
- Finally, you should also get into the habit of recording your targets. Much like the previous suggestion, recording where you took your final profit and if the market went much further beyond that target will be an important piece of information for the future. Maybe you are being too conservative with your target or maybe you’re being too hopeful. By taking note of this data, you will soon discover how good your analysis really is and how that will affect your probability of success.
In closing, always remember that our actions directly impact our final results. It can often feel like taking a step back is moving in the wrong direction. We prefer to look at taking a few steps back as actually building a springboard for a giant leap forward. We hope this was of help.
TRADING & INVESTING IDEAS
KO – The Coca-Cola Company
The Setup:
This stock has been clearly establishing a wider region of Fair Value. Zones are present at both extremes.
The Logic:
When markets are in Fair Value we can consider both Wholesale Demand and Retail Supply for trades – middle of range is first target for either zone.
The Zones

V – Visa
The Setup:
Visa like many of the Financial stocks, is also in a ranging pattern. A solid range gives great opportunity to both buy at demand and sell at supply.
The Logic:
When any market is in fair value, we need to avoid the middle area to stay safe. Looking to untested demand and supply zones for the best trades. Consider the middle of the range as the first target on either side of the trade.
The Zones:

Looking for those Hidden Bases…
Sometimes opportunity is hidden in plain sight. Many times, after a major momentum move up or down, the market fails to develop new demand or supply zones for us to enter for a directional trade. As you can see on the below chart of MSFT, the daily chart had two major up days in a row without creating any major demand. However, if we look at that overlap which is highlighted on the screenshot, we can see a different picture. By zoning down on this area to a smaller timeframe, in this case, a 2-hour chart, we can clearly see a well-structured area of demand with very little basing, and a clean backyard. Get in the habit of checking those overlapping candles on large time frames. They will often present well-structured supply or demand zone trading opportunities on smaller time frames if we take the time to drill down.


Show Me Who You Spend Time With and I’ll Show You Your Future
Think about who you spent time with during your development years, or even now. People in a group tend to pick up the habits and traits of the group. In high school, if you spent time with people who got into trouble, you most likely got into trouble. If you spent time with a group that regularly went to the gym, you most likely were in good shape. You get the point. There are many different types of trading groups but only two types of traders who join them. The first group consists of people who have a solid handle on trading but feel isolated and want to have more socialization. The second group, and much more common, is the group of new novice traders (and investors) that are searching for answers and ideas as they are not consistently profitable yet. If you join a trading group strictly for the social value, that can be a great way to make friends and be a part of a community. If, however, you join a trading group to share trading ideas and gain knowledge from other traders, be very careful.
While there are some great trading groups out there, it’s rare to see consistently profitable ones, so most likely you will be interacting with people who don’t trade properly. This means you might be at risk of picking up bad habits. There are groups that focus on everything from trading Fundamental analysis, Fibonacci numbers, Elliot Wave patterns, Trend, momentum strategies, and more…strategies that may not have stood the test of time because of the obvious flaws. You can find a trading or investing group on just about anything that has ever been talked about in the world of market speculating. The biggest concern is that trading groups tend to be focused on conventional technical and/or fundamental analysis which doesn’t likely lead to low risk, high reward, and higher probability trading. Instead, these schools of thought often teach people to take the opposite action of the astute trader- to buy high and sell low. Which is only good if you are on the other side of those actions.
What is actually happening in these groups is that the members don’t realize that there is a level of ‘brain washing’ going on because they all end up thinking the same way and reinforcing each other’s thoughts. The group becomes a single-minded thinking machine, and this can drive novice herd mentality trading and investing. Be sure to heed caution regarding trading groups if you decide to take that step along your trading journey. Make sure that the core strategy is focused on how you make money buying and selling anything in life- buy low and sell high
TRADING & INVESTING IDEAS
CADJPY – Forex
The Setup:
The CADJPY has been struggling to find clear direction for the last few months. As a result, we can look for Supply and Demand zones at the extremes of Fair Value.
The Logic:
When markets are ranging (Fair Value), look to further out wholesale and retail prices for trade opportunities.
The Zones

EBAY – Ebay
The Setup:
This stock is now showing strength from testing Weekly Demand and has room to go higher to reach Supply. We can look to go with this strength.
The Logic:
Ebay has formed strong Demand below and has upside momentum so we can look to go with this movement to ride it higher.
The Zones:

How and Why Price Turns and Moves in Markets
As you have heard us say many times, the movement in price in any and all markets is simply a function of an ongoing Supply and Demand equation. Market speculation opportunity exists when this simple and straight forward equation is out of balance.
The greater the Supply and Demand imbalance, the more likely price is going to change direction. Notice the Demand Zone below (Unfilled Buy Orders). This is a qualified Demand Zone because it has the four criteria that strongly suggests a large Supply and Demand imbalance, on the Demand side.

Notice the price action above that, the area labeled ‘Filled Orders’. There is a lot of trading activity and price easily moves higher and lower in that area. Price can easily move like this because there is a lack of a significant Supply and Demand imbalance. The setup on the left suggests we have a large stack of buy orders sitting right below an area where many orders have been filled. This means price is likely to turn higher when it returns to the Demand Zone and then move higher through the area of filled orders, which is exactly what it did.
This setup, like all setups, doesn’t offer us any guarantees. However, it does offer us a low risk, high reward, and higher probability buying opportunity. The key is to have a razor-sharp focus on Supply and Demand. Adding anything else to this time-tested governing dynamic is nothing but a distraction.
Governing Dynamics of Trading and Investing
Are the foundation of your trading and investing decisions in line with the laws and governing dynamics of supply and demand? If not, how are you able to buy low, sell high, and sell high, buy low to keep your trading and investing low risk, high reward and high probability?
One of the main reasons traders and investors of all types experience challenges when it comes to speculating in markets is because they can’t keep things simple and reality based. As humans, we are masters of complicating everything. Another human flaw is the ability for our minds to deceive us by way of illusion. Letting these two natural human flaws enter the world of market speculation typically can lead to losses in your account. This is why casinos do so well. They lose often but follow a rule-based strategy that ensures profits at the end of the day.
Many times, traders and investors want to add more strategies to their trading tool kit, add more indicators, and more information from the latest trading book or new strategy they see on the internet. What most people fail to see are the few basic and important principles that never change. Gravity is one that comes to mind and there are a few more. At the core of any significant economic, political, scientific, social, medical, psychological, or cultural theory lies a quest to understand and quantify the forces of change, action, or energy. The theories that attempt to quantify “force” that have stood the test of time, date back centuries and are extremely simple. In the 1600’s, noted physicist Isaac Newton suggested in his laws of motion that an object will remain in motion until it is met with an equal or greater force. Noted economist Adam Smith suggested hundreds of years ago in his book “The Wealth of Nations” that when supply exceeds demand at a price level in a given market, price will decline. Smith and Newton didn’t create or invent the laws and principles for which they are famous. Supply, demand, motion, and the relationships therein existed long before Smith and Newton, long before humans walked the earth for that matter. What these two individuals did, however, is look mass conventional perception in the face and challenge it with a reality that had been there all along. They were able to discover what no one else had because of a belief system that allowed them to open doors others never knew existed. If you notice, Newton and Smith didn’t figure out one specific issue. They had a belief system that allowed them to apply the core principles of their knowledge rather easily to a host of issues, producing answers the rest of the world still considers “ingenious”, centuries later.
Many other economic and scientific minds have come along over the years and presented the world with a new twist on the basic principles mentioned above and have won a Nobel prize for it. However, in many cases after winning the Nobel, that person is proven wrong. You can’t change what can’t be changed. Certain things in the world only work one way.
Governing dynamics are governing dynamics…were Newton and Smith really saying anything different or is the mathematical equation behind their breakthrough’s the same? The supply and demand in markets is Newton’s mass, and the motion is the movement of price from price levels where demand exceeds supply to price levels where supply exceeds demand. The point is that the ability to keep things real and simple can have positive results while complicating simple realities can hurt your trading and investing accounts quickly. Try and keep your thoughts and actions simple and reality based, most people don’t.
TRADING & INVESTING IDEAS
UNG – Natural Gas ETF
The Setup:
UNG has rallied and is nearing a gap Supply Zone with a profit zone below.
The Logic:
The gap typically represents the largest Supply and Demand imbalance. This one also represents a Pro Gap to the downside.
The Zones

EURUSD – Forex
The Setup:
EURUSD has been declining for many months and almost reached our Demand Zone. While the current profit zone with this opportunity is not great, this may change as Supply gets filled.
The Logic:
When price reaches Supply and Demand zones from long ago, this often means there are large imbalances in these areas.
The Zones:

TLT – 20 – Year Bond ETF
The Setup:
TLT has rallied and has an almost tested Supply Zone above. The profit zone should be ideal when price reaches this Supply Zone.
The Logic:
Notice how far price has to rally to reach Supply, this suggests a turn lower at that zone is likely. Also, this zone was almost tested, then price declined sharply. This suggests a large Supply and Demand imbalance at the zone.
The Zones:

Supply, Demand and Fair Value
The governing dynamics of Supply, Demand, and Fair Value are responsible for the movement in price in any and all markets. Let’s look at these three terms and then see how they work in the markets.
Demand (wholesale price): A price level where Demand exceeds Supply. Competition to buy at Demand causes price to stop falling and turn higher. It naturally ‘pushes’ price higher.
Supply (retail price): A price level where Supply exceeds Demand. Competition to sell at Supply causes price to stop rallying and turn lower. It naturally ‘pushes’ price lower.
Fair Value: The price range in any market where the majority of buyers and sellers agree to buy and sell. Therefore, it is the true magnet for price. It has the natural tendency to ‘pull’ price back to it.

Notice the buying opportunity in the NASDAQ here, from the Forum session. The NASDAQ had declined into a price level where our strategy suggested Demand exceeded Supply. At the same time, notice where current Fair Value is. The distance from Demand to Fair Value helps us assess profit zone and probability. Typically, the greater the distance from Demand (or Supply) to Fair Value, the higher the probability price will turn at Demand (or Supply).
Governing Dynamics: When price declined to our Demand Zone, competition to buy caused it to turn and pushed price higher. At the same time, Fair Value pulls price back to it.
Supply, Demand and Fair Value are how and why price turns and moves in any and all markets. It’s a governing dynamic that is as old as time.
Your Actions Will Always Define Your Results
Just today, I read that July 16th is National “Toss Away the “Could Haves” and “Should Haves” Day here in the USA. We didn’t even know this day existed. However, this National Day could not be more appropriate when it comes to the world of trading. I have never met any trader who has not experienced the roller coaster of regrets and missed opportunities to some degree. As we know, there are so many unknown quantities in market speculation, which often put traders into an emotional state leading to further bad decisions. For this very reason, we emphasize the importance of process and plan over all else. Unfortunately, too often, we take action for the wrong reasons. Be it a revenge trade or simply from the fear of missing out, subjective actions often lead to poor results. On the flip side, bad experiences can also lead us to a lack of action. After several undesired outcomes or losses in the markets, it can often be challenging to take the next trade setup that presents itself.
This is especially the case in more frequent or short-term day trading scenarios. Take a few losses in a row, and that little voice of doubt enters even the steeliest minds from time to time. The only way to overcome this is to be consistent and stick to a repeatable strategy that can be implemented and journaled repeatedly. We must take the losses to get to the wins. That’s the key dynamic of probability, after all.
Nobody knows what will happen next
This very situation occurred earlier this week during our Open Exchange session. As usual, we analyzed the three major Stock Market Indices 15 mins before the open and identified our ideal Supply and Demand zones for opportunity. Typically, we have one or two Supply zones marked off for shorts and one or two Demand areas for buying at.

In this case, we had identified two upper Supply zones on the YM (E Mini Dow Jones Futures) around the Globex overnight high. These were in an ideal location for a Globex Bull Trap strategy. Here is a screenshot of the areas at the open:

The Green dashed line is the Globex overnight high, with the 2 Supply zones marked A and B above it. As we can see from this example, both zones had decent structure, little time in the area, a decisive move away, and clean left/right action. They also were far enough away from current price to offer a solid risk to reward profile. A good practice, no matter the style of trading, is to let price come to your entry rather than chase it after it starts to move. This is especially helpful during higher times of market volatility, such as around news announcements and the stock market open and close. Shortly after the open, the price rallied to Supply Zone A and overshot the zone, resulting in a small loss:

However, not only did the trade get stopped out, but it also then dropped after the loss. Seeing a setup fail via a small margin, to only then turn around and work can be a frustrating experience for anyone. This often leads to chasing price when we feel robbed of success. We should remember that this was not the plan. We had two zones for consideration and must stick to the plan. Supply Zone B was still in play and was good for a later entry regardless of the failure of Zone A. Here is how things worked out:

Supply Zone B triggered with a drop of over 1000 points in the following few days. A major win that greatly offset the small and frustrating loss on zone A. The question to ask yourself is, would I have taken the second trade after losing the first? To be consistent, we must act on all pre-qualified trading opportunities that meet our plan. It is often the trades we don’t take that cost us more than trades we do take. The goal is to treat each opportunity as independent of the previous outcomes. This is the key to consistency. When it comes to trading, there is no place for the “should haves”, the “would haves” and the “could haves”. Only action gets results.
TRADING & INVESTING IDEAS
AUDUSD – Forex
The Setup:
The AUDUSD pair has been seeing declines for some time but is close to major historic wholesale prices. Position Trade potential.
The Logic:
The AUD has held up well against the dollar versus other currencies and this is a rare chance to buy at Weekly Demand for low risk and high potential reward.
The Zones:

FDX – FedEx
The Setup:
FDX is ranging but also strong in a weak market. A drop to Demand would offer a buying opportunity with Supply Zones for targets above.
The Logic:
FDX has been showing stability against a weaker broad market backdrop. This has the potential to bounce from its unfilled gaps if the markets show strength.
The Zones:

Mini-Lesson: 3 Strikes and You’re Out…

Much of trading is just learning to be practical. As you have probably heard many times, risk management is perhaps the most important aspect of market speculation. Staying in the game long enough to endure the small losses and take the big wins is fundamental to long-term success. However, practical risk control is about more than just using a stop loss order or correct position sizing. It is also about self-control and enforcing discipline at all times. Over many years of teaching and mentoring traders, we have seen overtrading as one of the biggest issues of them all. Whether you are a swing, position, or day trader, limiting the number of trades you take is a great way to control your downside. We all have challenging days or weeks in the markets. It is par for the course. Yet how we deal with these times is the major difference maker. A simple suggestion for anyone struggling with the frequency trades they are taking should simply use the Three Strikes Rule. After three losses, walk away for the day or the week, depending on your stye of trading. Of course, there will always be the temptation to get back at the market but when your mind is not right and you’re in revenge mode, things can turn ugly in a flash. True professionalism in trading comes from knowing when enough is enough. Control the bad times and the good times will take always take care of themselves.
Profit Zone – The Key to Everything
Our routine begins with proper analysis of Supply and Demand, where significant banks and financial institutions are buying and selling. We use our proprietary Structure and Location analysis to do this. A key result of this is knowing the objective profit zone, which is the focus of this lesson. Recently in a live trading and analysis session with our members, we used our rule based supply and demand analysis to identify a low risk, high reward, and high probability trading opportunity. Notice the first time price revisits demand. Our rules tell us here that novice traders are likely selling. We know this because these sellers are selling AFTER a decline in price- mistake number 1, and they are selling AT a price level where the chart already told us demand likely exceeds supply- mistake number 2. The objective laws of supply and demand ensure that the trader who commits these two mistakes will likely lose.
Let’s now discuss the key point that made this trading opportunity a high probability. Notice how price declined to our Demand zone and the distance up to the Supply zone. It was a strong decline built with NO SUPPLY levels during the decline. This means that as soon as price reached our demand, it was likely to rally very quickly. The ideal setup is for a strong move into our Demand zone as that increases the odds of a strong reversal. In other words, price reached our demand zone where our strategy suggested price was likely to move through the very clear “Profit Zone”.

TRADING & INVESTING IDEAS
XLE – Energy Sector ETF
The Setup:
XLE has established Fair Value below a key Supply zone. The Profit Zone for this is also strong as price has declined below $68 already.
The Logic:
The Energy sector has been week for weeks. The larger the Profit Zone, typically the higher the probability the trading opportunity is.
The Zones:

XLK – Technology Sector ETF
The Setup:
XLK has recently turned higher at a good location area of Demand. Below that area is another Demand Zone which is the focus of this opportunity.
The Logic:
This opportunity has a large Profit Zone. The larger the Profit Zone, the higher the probability typically.
The Zones:

XLP – Consumer Staples Sector
The Setup:
XLP has established fair value and has a qualified Demand Zone just below. The profit zone through fair value is ideal.
The Logic:
This has been a relatively strong sector. When price declines back to Demand zones in stocks, its typically higher probability to buy a strong sector.
The Zones:

Trading and Investing Challenges
When you decide you’re going to get involved in self-directed investing or dive into a trading career, you are typically making that decision because of the potential financial gain. You are making the decision because of the perceived benefit. What most people don’t understand, let alone even consider, is that they are about to step into a world of challenges that have the potential to really hurt their bank account and self confidence all at once. One of the biggest challenges people face is having the self-control to execute a plan. The group that focuses on the financial prize tends to lose money whereas the group that focuses on the challenges seems to have a better chance at reaching their goals. It ends up being one group providing income and wealth for the other. Welcome to trading and investing.
Self-Control: This is a must. If you don’t have self – control (discipline) in other parts of your life, don’t think you will magically have it when you start trading. Trading will challenge your discipline more than you can imagine. From birth, we run toward things that make us feel good and run from things that we are afraid of. Proper trading and investing means you have to think the opposite. What I mean is that we want to buy low and sell high. To buy low when prices are cheap, you need to buy when everyone else has sold, with down sloping indicators, accompanied by bad news, and so on. The act of buying low and selling high is not comfortable for the human mind when trading and investing. In other parts of our lives we have no problem trying to buy things on sale. However, when speculating in markets, most people do the opposite for the reasons I just mentioned.
Don’t let the desire to reach the financial prize lead you to ignore the challenges that come with trading and investing. Instead, channel your strong determination into energy that allows you to follow your rules.
Always Look for the Path of Least Resistance
Overcomplicating a situation is an easy mistake to make in life. Seeing things for what they are rather than what we think they should be, is a skill often learned the hard way. In many respects, market speculation draws many parallels to day-to-day life. How many times have we been guilty of rushing into a problem by trying various fixes, only to make things worse? Of course, when it comes to the markets, this is a very easy situation to find ourselves in. Especially when we throw the emotions generated by the gain and loss of money into the mix. It is for that very reason that we should constantly strive to keep things as clean and simple as possible in our trading strategies and our analysis. The facts are simple: markets can go up, markets can go down, and markets can range. Knowing when to take advantage of these potential movements is key. The complication comes from the fact that we can enter whenever we want to.
But this does not mean that it is the right thing to do. Any seasoned trader will tell you that the fewer opportunities we have in the markets, the better it often is. Applying a rules-based logic and a solid filtering system to your strategy and trade plan is one way to drastically increase your potential probability of success and reduce your risk simultaneously. Here we will share one of our favorite methods of doing this during our Open Exchange sessions.

Less is typically More…
When trading stock index futures, we can choose whether to chart them over a full 24-hour period or to chart them over the regular NYSE trading hours of 9:30 AM to 4 PM Eastern time. Remember that unlike stocks, futures markets trade 24 hours a day for almost 6 days a week. However, we should also remember that just because these markets trade 24 hours a day, this doesn’t mean that there will be good solid opportunities around the clock as well. The safest time to be trading stocks and stock index futures is typically during the higher volume market hours of 9:30 AM to 4 PM ET. This time period is commonly known as the Regular Hours of trading or the Cash Session. The hours outside this period are usually referred to as the Extended Hours. The diagram below shows a 24-hour futures chart of the YM [E-mini Dow Jones] contract:

You will see the gray shaded area represents the overnight hours, and the smaller section in white represents the regular hours. In most cases the regular hours see the greatest price movement and by far the highest level of trading volume. In the Open Exchange live sessions, we typically only chart the regular hours. The question is why? The answer to this goes back to our original point in the article. The less we see usually equates to better opportunities. Supply and Demand zones which are created in the regular hours tend to be more robust because they were created on higher volume. We will have less choice of zones. Less choice means we must be more selective in our trading and only focus on the high probability set ups. It is easier to see the set ups when we are looking at less data, as shown in this example:

By using the regular hours only to chart our stock index futures, we see clean zones that were created on higher volume. We also see the price gaps from major market imbalances overnight. As you know from the Pinnacle Method, price gaps can be powerful supply and demand zones and can only be seen when charting the regular hours. One other advantage that is often forgotten, is that by charting the stock index futures between 9:30 AM and 4 PM Eastern, our charts will line up perfectly with the underlying stock ETFs. Look at this example where you can see the YM and the DIA ETF perfectly in sync:

The cleaner and simpler that we can make our analysis, the easier and less emotional it is to execute. With so many potential moving parts, we should always strive to focus on the fundamental aspects that are key to the decision-making process. Always try to remove any distractions from your strategy, and any obstacles that will only hold us back from a truly objective trading methodology.
TRADING & INVESTING IDEAS
XLV – Healthcare Sector ETF
The Setup:
XLV has been in a steady decline but has rallied to Weekly Supply with Demand much lower.
The Logic:
Supply has been in control and this latest rally is likely profit taking. An ideal opportunity for an Options trade at Weekly Supply or to short weaker stocks in this sector.
The Zones:

HES – Hess Corp

The Setup:
HES is holding its lows well and new Demand has formed above previous lightly tested Demand. This stock has also established fresh Supply higher for targets and entries short.
The Logic:
While broad markets are holding their lows, the energy sector has held strongly. These areas offer buying opportunities but with weakness still in the markets, the above supply would offer an objective profit target.
The Zones:
Avoid stepping over Dollars to pick up Dimes…
As we know, consistency is critical in our trading and investing. Whether you are a long-term position trader, swing trader, or intraday speculator, sticking to doing the same thing repeatedly is key. Being consistent means trading your zones as you find them. Often, we see traders missing great setups by trying to be too precise with their entries. For example, we recently had a solid supply zone trigger on Amazon in the Close Exchange, which was predetermined as a swing trade set up and executed on the daily charts. At the time of writing, we have already surpassed our halfway target. However, if you had attempted to tighten up this daily area too much, the outcome of the trade would’ve been very different. Notice how on the one-hour chart, there were two supply zones marked in red? Both areas were located within the larger daily zone. The upper zone never triggered, and the lower would have resulted in a stop-out, only to see the market go down. If your risk does not allow you to take larger zones, you can always wait for a confirmation of the area and enter a smaller chart. Another solution would be using Options, where we could sell Credit Spreads at the larger area or Buy Options if the premium is low enough to warrant the risk.


What is Your Trading Style?
Everyone already has an ingrained trading style, it’s simply your belief system. Changing your trading style requires a shift in your belief system, which is no easy task. Moves in the markets are a result of psychology, supply, and demand. Profitable traders make money in the markets by being masters of psychology, in addition to supply and demand. Winning or losing in the markets is more of a result of your mental make-up than your actual trading style. What is more important than chart reading or understanding fundamental analysis is to first understand how people think.
If you’re experiencing challenges with trading or investing, instead of focusing on changing your actions, have you first thought about where those actions come from? Starting from the beginning one step at a time, actions stem from behavioral patterns, and behavioral patterns stem from beliefs. So it’s at the level of beliefs (thoughts) that decisions are made, and moreso, your ability to differentiate reality from illusion. It’s time to take a deeper dive into where your beliefs about what works and what doesn’t in trading and investing comes from.
In life most of us tend to repeat the same processes over and over expecting a different result, and that equally carries over to our trading and investing. Research suggests that the majority of active traders lose money. And from our experience in the business of trading, there are some very clear differences between the consistently profitable trader and the consistently losing trader.
The Faulty Belief System
Follows the herd
Watches and does what others are doing
Takes comfort in numbers
Avoids taking risk unless others are sharing the risk as well
Feels that if others are buying then it is “ok” for them to buy also
Acts on the advice of so called “experts”
Complicates the trading process and ignores the important simplicity of markets
Tends to make the same two mistakes:
Buy and sell after a move in price is well underway (late and high risk) and they buy at price levels where our strategy tells us supply exceeds demand (low probability)
Sell at price levels where our strategy suggests demand exceeds supply
The Proper Belief System
Leads the herd
Tunes out all the noise that gets in the way of making proper buy and sell decisions
Disregards what others are doing, and makes decisions based on a mechanical and unemotional set of rules based solely on the laws and principles of supply and demand
Often identifies the proper entry that most people never see
Buys after a period of selling, at or near demand (buys fear)
Sells after a period of buying, at or near supply (sells greed)
Successful traders:
Identify opportunity before others
Execute trading plans (rules) mechanically
One of the most important things to understand about proper trading and investing is that conventional visible confirmation and low risk opportunity are completely inversely related. This is a game changer once you fully understand it, and it’s what separates the successful and unsuccessful buyer and seller of anything. This is why those who know what they are doing often get paid from those who don’t. This is how the markets work.
TRADING & INVESTING IDEAS
EURUSD
The Setup:
The EURUSD has established Fair Value below a key Supply zone. The US Dollar has an opposing Demand zone in the same area which should offer inverse help. The Profit Zone for this is strong.
The Logic:
Notice the distance from Supply to the middle of Fair Value. This typically suggests a higher probability opportunity.
The Zones:

XLK – Technology Sector ETF

The Setup:
XLK has turned higher at larger time frame Demand and has developed more Demand as seen on the chart. The Profit Zone higher is good.
The Logic:
Notice the gap higher from the Demand zone. This suggests a strong Supply and Demand imbalance at the Demand zone.
The Zones:
AMD – NASDAQ Stock
The Setup:
AMD has been declining for months and has reached a Demand zone that is likely to produce a tradable bounce higher.
The Logic:
Major Stock market Demand just below should help AMD turn and remain above this Demand zone for a while.
The Zones:

Breakout Trading
Many traders handle breakouts completely wrong. Often, traders let emotion complicate what can really be a simple and rule based strategy. Trading breakouts can be high risk, high stress, low reward, and low probability or this strategy can be low risk, low stress, high reward, and high probability. The difference lies in how you “think the markets”.
Before getting into the details of the strategy, it’s important to understand two key components of markets.
-
How and why does price turn and move in any market? Price in any market turns at price levels where demand and supply are significantly out of balance. Price moves easily thought price levels where supply and demand are in relative balance.
-
Who is on the other side of your trade? Trading is simply a transfer of accounts from those who don’t know what they are doing, into the accounts of those who do. The astute trader understands who is on the other side of their trade as the buy and sell actions of the novice and professional trader are clear.

The Logic
Notice area “A”. Area “A” is the origin of a strong rally in price. Most breakout traders will look to buy as price breaks out to the upside from area “A”. This type of breakout entry is typically the “sucker bet”. Traders see price moving higher from area “A” and they give in to emotion and buy into that initial rally because they see others buying. The problem is that by the time you buy the breakout of area “A”, price has moved so far that it becomes a high risk and low reward trade. Instead, consider sitting back and let the breakout happen because that breakout tells us there is a demand and supply imbalance at the origin of area “A”, this is likely where financial institutions are buying. Next, wait for price to return to area “A”. When it does at “B”, we are likely offered the opportunity to buy from a novice seller. We conclude this because the seller at “B” is making the two mistakes that every consistent losing (novice) trader makes. First, they are selling after a period of selling and second, they are selling at a price level where demand exceeds supply.
The Setup
An ideal pattern is a base and rally. In other words, breakout “A” should be preceded by short sideways base. Then, make sure there is a significant profit margin (profit target). This would be the distance from area “B” to the horizontal line above.
The Action
Consider buying at “B” and place your protective sell stop just below the lower black line. Adjust your position size so that you are not risking more than you are willing to lose. Place your profit target based on the high of the initial breakout “A”.
The Difference Between What You THINK and What You KNOW
Any seasoned trader or investor will tell you that successful participation in the markets is about striking a balance between strategy of the charts and strategy of the mind. Both aspects are mutually important, but unfortunately mastery of one does not automatically entail mastery of the other. Many amateurs fail to realize this. A mentor once told me that being right in the markets is not the key to success, as process and strategy application will always take precedence. I found this a difficult concept to grasp at first, as do most. However, over time I began to appreciate the lesson in greater detail. While winning trades are needed for overall gains, my mentor constantly stressed the importance of executing a systematic methodology. We can all be right on a trade from time to time. Trading, after all, is about stacking probability in our favor and embracing logic over emotion.Logic dictates that when Demand exceeds Supply, prices rise and when Supply exceeds Demand, prices fall. Our methodology recognizes this approach over all else. Even when we are wrong, and we will be wrong, the key is to follow a proven process and let the system work for us. For this to happen, we need to embrace objectivity above all else.
Accept that we really know nothing…
If we fail to follow an objective plan, we run the risk of trading emotionally. As we know, emotional trading never leads to good results. Subjectivity can easily creep in, leading us to make decisions based on what we think is going to happen rather than what we see is happening. Following a plan is not easy.

This is one of the many reasons why most novice traders fail. But if we can be truly objective and allow patience to do its thing, the signals become clearer.Here I have a perfect example of this concept. Take a look at the chart of the Dow Jones futures below:

Notice how we are approaching the demand zone on this daily chart of the YM. We have been seeing Bearish downside momentum, which at the time suggested the demand zone was less likely to hold. However, that is a subjective opinion based on what we think may happen. Demand zones, especially on larger time frames like daily charts and higher, usually produce decent reactions in price. Therefore, it makes sense to respect this demand zone and expect a bounce from this area regardless of what we think. This is the objective opinion. The market did in fact break through the demand zone and our level did not hold, as we can see here:

The important lesson here is that we shouldn’t let our opinion get in the way of what we see on the chart. Even if the zone fails, we stick to the plan. The market could’ve easily rallied from this broken demand zone. Even though it failed, we followed the plan. With no demand below this area, we now expect price to full father. Objectively we should wait for a supply zone to form after this large demand zone has broken. This is exactly what happened on the smaller 15-minute charts. Let’s take a look:

After Price broke through the 31683 distal line of the daily demand zone, it created a new supply area marked in red on the 15-minute chart. This gave us a low-risk opportunity to enter short with a tight stop and plenty of profit below. To take advantage of this scenario, the trader needed to be objective, patient to wait for confirmation of the demand zone being broken, and then prepared to take the next trade after a loss. Opportunity would have paid off nicely if all this criteria had been met. There is nothing wrong with having an opinion in the market but letting that opinion make subjective decisions for you is where the main dangers lie. The goal is to trade what is in front of you, and then plan around the signals that the market gives you. Stick to this ideology and you will enjoy a safer and less stressful trading environment.
TRADING & INVESTING IDEAS
GS – Goldman Sachs Weekly Chart
The Setup:
GS has been in a steady decline but has room for a bounce soon at Major Weekly Demand.
The Logic:
Supply is in control but profit taking will likely happen at larger time-frame areas. Notice Demand secondary evidence at the Weekly Demand zone.
The Zones

CDNS – Cadence Daily Chart

The Setup:
A good opportunity to play the range on this stock, with Demand and Supply well established on both sides.
The Logic:
Considering the weaker stock market, CDNS has held up well and is ranging, showing relative equilibrium. The stock could benefit from Monthly levels of Demand being tested on the Broad Markets. Also, could be used on a non-directional Options play when in Fair Value.
The Zones
Don’t Be Color-Blind
This week’s article has maintained the theme of the importance of objectivity. To continue that trend, we would like to share a very quick tip to help keep us grounded when drawing our zones. Most of us pay too much attention to the color of the candlesticks and this can be very misleading. More importantly, we should be focusing on strong rallies and strong drops, tight bases, and left right zone structure. The color of the candles is inconsequential. The structure of the zones is critical though, and we do not need a rainbow pallet to see this. If you find yourself getting confused over zones, you can simply make all of your candlesticks one color. You will still be able to see the zone structure and maybe even notice zones faster. Give it a try and let us know how you get on!


Are Your Trading/Investing Buy and Sell Decisions Based on What’s Real,or What You Feel?
Consistent low risk profits from trading and investing are a challenge many people take on, yet only a select few are ever able to attain. The logic and rules for properly buying and selling in any market are not that difficult, yet the layers of illusions keep most from ever seeing what is real in trading and investing. While buying at wholesale prices and selling at retail prices is how almost any business runs, clearly seeing and executing this in the financial markets is typically very confusing for traders and investors and there are clear reasons why.
The two main forms of analysis in trading and investing are technical and fundamental analysis, and they are very real. However, thinking that mastering these two forms of “conventional” analysis will lead to consistent low risk trading and investing profits is an illusion second to none. The more an individual attempts to master these types of analysis, the more they may be layering subjective complex illusions on top of each other. This can be a recipe for failure.
What many beginning traders don’t realize is that they are walking east and west, trying to reach the North Pole. No matter how hard they work, the goal they desire is not attainable as the path they are on is an illusion. Trading strategies that work don’t change with time or changing market conditions. To think market conditions ever change at all is a strong illusion that can only be removed when one focuses on the foundation principle of price movement: supply and demand. A simple and minor shift in perception to what is real can lead to a monumental shift in the trading and investing mindset.
The focus of this piece is to identify and remove the veil of illusion from trading and investing. How? By realizing that the movement of price in any market is based at its core on an ongoing supply/demand and human behavior relationship. We will quantify a supply/demand imbalance for rule based opportunity in this article. As most traders are well aware, the overall goal is to decrease risk and increase profit potential. But many novice traders’ strategies actually accomplish the opposite. Results for everyone from the active trader to the casual investor follow from taking various actions. Instead of focusing on changing our actions, it’s time to notice where those actions come from.
Beliefs and Behavior Patterns = Actions
Let’s move backward one step at a time. Actions stem from behavioral patterns, and behavioral patterns stem from beliefs. It is at the level of beliefs that decisions are made, and moreover, where your ability to differentiate reality from illusion lie. It’s time to start considering where your beliefs come from about what works and what doesn’t. The strongest illusions in the trading and investing world are found at the core of fundamental and technical analysis. Within these two forms of analysis lie many levels of illusion. In this piece, I will focus on three major illusions.

Moving Averages
The Illusion:
The chart above is a weekly chart of the S&P 500. The information most people will perceive from this chart is an illusion that will likely lead to high risk/low reward trading and investing. The illusion here is that moving averages (MA) somehow act as support or resistance. There are many conventional ways in which some traders use moving averages. These include using moving average crosses for entries and exits, measuring the slope of a MA for a “trend filter,” or using a MA as support or resistance. However, the notion that MA’s actually offer a benefit when used in these conventional ways is completely false. It is an illusion.
In this chart, a 20- and 200-period moving average are seen. These are widely used moving averages both in the trading and investing community. Notice the slope of the 20-period MA at “B.” The slope of the 20-period moving average is down, suggesting a downtrend is underway. During this period however, the low risk/high reward buying opportunity is greatest and right in front of you.
Those who use a MA as a trend filter would never buy when the trend is “down.” This group of illusion-based traders and investors would likely conclude and say; “I don’t want to buy now, the MA tells me this is a downtrend.” The illusion created by using a MA to determine trend can lead you to ignore the lowest risk/highest reward opportunity when it is offered. Furthermore, this illusion is likely to encourage a trader to take the opposite action of what the objective Supply and Demand information (reality) suggests he or she should do.
Moving Averages Lag
MA’s are averages of past data. They can only turn higher after price does. Let’s focus in on the 200-day moving average. Specifically, notice area “B” that is below the 200-day MA. Most traders and investors either see the 200-day MA on a chart or hear about it from some financial news TV program. They perceive the mighty 200-day MA as some magical line that when crossed suggests some valuable information. As we can see, waiting for prices to rise above the 200-day MA before buying ensures three things. First, risk to buy is high, as one would be buying after a big rally in price and far from the demand zone. Second, profit potential is decreased. Third, those who wait until prices have crossed back above the 200-day MA to buy will likely provide profit for the reality-based trader/investor who bought at “B,” the low risk/high reward entry area. The objective supply/demand imbalance is at “B,” and the 200-day MA has nothing to do with it. When a moving average lines up with true demand or supply, the moving average will appear to work. Believing that the moving average actually has anything to do with a turn in price is an illusion.
The Reality:
Let’s now explore reality through the eyes of objective logic. The area labeled “A” is a demand zone. How can we claim demand exceeds supply at this level? Simple, while prices are trading sideways, supply and demand appears to be in balance. Then, prices rises in strong fashion from this area. The only thing that can cause a price rally from that area is when the supply and demand equation is “out of balance.” In other words, there was much more willing demand at “A” than supply. The laws of supply and demand simply tell us this is true.
The area labeled “B” represents the first-time prices revisits this area of “imbalance.” In other words, price has declined to an area where there is more willing demand than supply. “B” is the low risk/high reward opportunity to buy. Buying in this area ensures three important things. First, your protective stop is small which offers a trader proper risk management/position sizing. Second, your profit potential, which is the distance from the entry to your profit target above, is as large as it will ever be for this opportunity. In other words, as price moves higher from the demand zone, it is moving closer to supply above, decreasing your profit potential. Third, the probability of success is highest because supply and demand is very much out of balance at that level.
The Lesson:
Indicators and oscillators are nothing more than a derivative of price and volume. Adding any tool to your decision-making process that lags price only increases risk and decreases reward. Price is all that need be considered when performing objective, reality-based analysis.
The supply zone was marked off, with a specific entry, stop and first target at the red line which says GX low. Once the zone was identified we play the waiting game as Price must get to the entry. This can be challenging for most novice speculators. The market took a few hours to get to the supply zone but was worth the wait as we can see from the result:

Above is a chart of the S&P. During this live trading and analysis session, we were going over a demand zone with our members for a potential buying opportunity at demand. Above 30 minutes later, an economic report came out, Consumer Price Index (CPI) and the number came out worse than expected. This brought many sellers into the market, causing price to gap down at the open, right into our demand zone. Once the last news driven seller sold, at a price level where our supply and demand analysis suggested demand greatly exceeded supply, price rallied up to fair value. The combination of a very negative news event and a quality buying opportunity brings us to our next illusion, the news.
The News/Fundamentals
The Illusion:
The news (which often includes economic reports) illusion is the most powerful illusion in trading and investing as strong news leads to strong emotion (faulty beliefs). Most successful traders and investors have at some point in their journey to consistent profits fallen prey to this illusion. How many times have you seen bad news turn into a positive day for the markets? The news in the case of CPI was very real and bad.
The thought of a negative economic report led many to believe that prices would fall, that belief drove the majority to sell. Once the last seller sells at a price level where willing demand exceeds willing supply, the laws of supply and demand tell us prices rise.
The Reality:
The demand zone on the chart is the point in which prices move higher from the consolidation. Also, notice how strong that initial rally was. This suggests there was a big supply/demand imbalance in that zone.
When price came back to that zone the first time, many were selling because of the bad news. This offered us an opportunity to buy the S&P on sale, at the demand zone. The news was very real, very bad, and prices fell. However, once they reached demand, where there was objectively more demand than supply, prices turned higher.
The Lesson:
Strong news actually creates powerful turns in the market, opposite of what the majority expects because one side (buyers or sellers) exhausts itself into a price level where an objective supply or demand imbalance exists. No matter how bad the news is, when the last seller sells at a price level where demand exceeds supply, prices rise. There can be no other mathematical outcome.
A trader’s path must be reality based, not driven by illusion. The reality is that markets are nothing more than pure supply and demand at work; human beings reacting to the ongoing supply/demand relationship within a given market. This alone, ultimately determines price. Opportunity emerges when this simple and straightforward relationship is “out of balance.” When we treat the markets for what they really are, and look at them from the perspective of an ongoing supply/demand relationship, identifying quality trading and investment opportunities is possible.
TRADING & INVESTING IDEAS
QQQ – NASDAQ ETF
The Setup:
The NASDAQ has recently turned lower from our Supply Zone and is nearing Demand below. This Demand Zone is inside the range which is a little lower probability.
The Logic:
Notice the strong move higher from Demand. This suggests an above average imbalance at the Demand Zone.
The Zones

XLY – Consumer Discretionary Sector ETF

The Setup:
XLY has turned lower at our Supply Zone. There is plenty of room down to the Demand Zone creating what currently is a good Profit Zone.
The Logic:
Price gapped higher from the Demand Zone. The gap represents a large Supply and Demand imbalance. The larger the imbalance, the more likely price is to change direction.
The Zones
QCOM – Qualcomm Inc.
The Setup:
QCOM is trading lower with the NASDAQ markets and is nearing a Demand Zone. Currently, there is a healthy Profit Zone (PZ) above. The PZ can change but this is the current opportunity.
The Logic:
The Larger the Profit Zone, typically the higher the probability. Profit Zone and probability go hand in hand. Distance from Fair Value is the key.
The Zones

Breakout Trading
Many traders handle breakouts completely wrong. Often, traders let emotion complicate what can really be a simple and rule based strategy. Trading breakouts can be high risk, high stress, low reward, and low probability or this strategy can be low risk, low stress, high reward, and high probability. The difference lies in how you “think the markets”.
Before getting into the details of the strategy, it’s important to understand two key components of markets.
-
How and why does price turn and move in any market? Price in any market turns at price levels where demand and supply are significantly out of balance. Price moves easily thought price levels where supply and demand are in relative balance.
-
Who is on the other side of your trade? Trading is simply a transfer of accounts from those who don’t know what they are doing, into the accounts of those who do. The astute trader understands who is on the other side of their trade as the buy and sell actions of the novice and professional trader are clear.
The Logic
Notice area “A”. Area “A” is the origin of a strong rally in price. Most breakout traders will look to buy as price breaks out to the upside from area “A”. This type of breakout entry is typically the “sucker bet”. Traders see price moving higher from area “A” and they give in to emotion and buy into that initial rally because they see others buying. The problem is that by the time you buy the breakout of area “A”, price has moved so far that it becomes a high risk and low reward trade. Instead, consider sitting back and let the breakout happen because that breakout tells us there is a demand and supply imbalance at the origin of area “A”, this is likely where financial institutions are buying. Next, wait for price to return to area “A”. When it does at “B”, we are likely offered the opportunity to buy from a novice seller. We conclude this because the seller at “B” is making the two mistakes that every consistent losing (novice) trader makes. First, they are selling after a period of selling and second, they are selling at a price level where demand exceeds supply.
The Setup
An ideal pattern is a base and rally. In other words, breakout “A” should be preceded by short sideways base. Then, make sure there is a significant profit margin (profit target). This would be the distance from area “B” to the horizontal line above.
The Action
Consider buying at “B” and place your protective sell stop just below the lower black line. Adjust your position size so that you are not risking more than you are willing to lose. Place your profit target based on the high of the initial breakout “A”.
Is it Trading or Waiting?
When you think about the concept of trading, typically activity comes to mind. Most people imagine professional traders sitting at their computer screens and constantly clicking buttons. In reality, this couldn’t be further from the truth. How many times when you were a child did your parents tell you to be patient? I think most of us have probably lost count. However, there is merit in the saying that ”good things come to those who wait.” Ask yourself how many times you have rushed into a situation and then regretted it? How many times have you acted on impulse and wished that you just waited a little longer? When trading the financial markets, we are constantly given signals to enter and exit the market. Unfortunately, most of these are false signals. Without patience it can be a challenge to recognize the difference between the right and wrong opportunities. This is why Patience is so important.
Always Trust and Be Patient…
Anyone with a solid grasp of how supply and demand really works in the market, will understand the importance of letting Price come to you. The reason key levels develop is because of a major imbalance between the buyers and the sellers. The optimal entry will always be to buy or sell at these areas. Prequalified demand or supply zones typically offer the lowest risk, high probability and highest potential profit. To capitalize on these opportunities though, we must wait for Price to reach these entry points. For some, the waiting is easy as they know the importance of a good entry.
For the majority of traders out there, they want the result right now and waiting is simply not an option. They typically find themselves jumping into the market with little to no plan. But think about this: the idea of trading as we mentioned suggests tons of activity. The reality is often the opposite. Less typically means more when trading, and if you are willing to wait for the right opportunities this will require patience. Typically, it does not matter whether the market is ranging or trending. Waiting calmly for the optimal entry will always be a requirement for success. Let’s take a look at a recent trade set up in our Open Exchange live session:

In this session on May 31st, we were looking to identify optimal buy and sell opportunities in a ranging market. Being overly aggressive with your entries in these conditions can be costly. The key is to always go to the extremes for your ideal entries. Just before the market opened at 9:30 AM eastern time, we identified a key supply imbalance on the ES futures:

The supply zone was marked off, with a specific entry, stop and first target at the red line which says GX low. Once the zone was identified we play the waiting game as Price must get to the entry. This can be challenging for most novice speculators. The market took a few hours to get to the supply zone but was worth the wait as we can see from the result:

Once price triggered our entry we hit our first target for a quality day trade. This also resulted in a longer-term opportunity the next day where the ES fell almost 100 points. Most trading days do not offer multiple opportunities. As human beings we typically like to get the results as quickly as possible. Experience however, suggests that good things do come to those who wait after all. Really it all comes back to discipline, the most important dynamic in consistent trading. Whether it’s discipline to stick to a plan or discipline to be patient, there is no denying its importance in the quest for ongoing success.
TRADING & INVESTING IDEAS
ZM – Zoom Daily Chart
The Setup:
Zoom has been in a long-term pattern of weakness and recently bounced from Monthly Demand. A major test is coming as we test Weekly Supply.
The Logic:
Sell at Supply Zones when we have weakness in the price action. Be aware also that Monthly levels are ideal reversals and can be tested more than once before the largest reactions.
The Zones
128.57 – 136.00
————

NKE – Nike Weekly Chart

The Setup:
This is a Position Trade opportunity on Nike. The Weekly chart shows weakness with a test coming up on untested Supply with clear untested Demand below.
The Logic:
There is still plenty of downside white space on this chart and the profit margin is solid. We have 2 Supply areas above with little Demand below, suggesting further drops in price.
The Zones
146.95 – 138.80
————
Beware of The Wicks
As we know, not every turn on a price chart is truly a quality supply or demand zone opportunity. Concepts like price support and resistance are not the same as pre-qualified supply and demand areas. This also applies to wicks on candlesticks. Traders often treat wicks as extreme buying and selling opportunities and sometimes price does react to them. However they do not represent a true imbalance. A wick really signifies an emotional move up or down that was unsustainable. Avoid the mistake of trading near wicks. These are not true demand or supply areas. A better approach would be to be patient and wait for a Demand or Supply imbalance to form in the wick area. This can then be used for a later entry.

Is Your Ship Sinking?
Ships don’t sink because of the water around them, they sink because of the water inside them. There will always be challenges happening around us. Some will be in our control, and some will not. The key is to not let negative influences that are out of our control impact us and sink our ship. The separation in your mind needs to happen at the level of the ‘influence’. With trading and investing this is where most people get it wrong and lose money, or never come close to achieving their financial goals.
All influences on price are reflected in price.
When you really understand this concept, you realize all that needs to be considered is Supply & Demand and price itself to make your trading and investing decisions. ‘Why’ the Supply & Demand is present is irrelevant, yet that (influence) is what most people focus on.
The ocean of influence is massive but our trading and investing ship can be very healthy if we keep the water outside of it. Focusing on news, reports, and all the influences on price is a problem. This is why… when news or reports are “good”, most people get bullish and buy. What they don’t realize is that by the time the news and data (influences) are good, the price of the market in question is at or near supply (retail prices). When the news and reports are “bad”, most people get bearish and sell. What they don’t realize is that by the time the news and reports are negative, price is almost always at or near demand (wholesale prices). This leads to most market participants taking the opposite buy/sell action as they should at key turning points in the market. This is the primary reason most traders and investors never come close to achieving their financial goals, they let the water into their ship on purpose without even realizing it.
So make sure your strategy to buy and sell in markets is in line with how you make money buying and selling anything in life. Then make sure you focus on price, and price alone, and not any of the influences on price. This should help you buy at demand (wholesale) and sell at supply (retail) which is key in achieving financial goals. Focus and make decisions based on what’s real, not what you feel.

TRADING & INVESTING IDEAS
QQQ – NASDAQ ETF
The Setup:
The NASDAQ has recently turned higher just above our 277 Demand zone. There is also a new Demand zone with room to Supply above. The near-term range is likely to be between the Demand and Supply zones below.
The Logic:
When price reaches a price level where it turns higher before reaching Demand, this suggests the market has reached a level where Demand exceeds Supply.
The Zones:

XLI – Industrial Sector ETF

The Setup:
XLI has been declining for months. For the first time in a while, price was not able to reach a Demand zone and turned higher.
The Logic:
When price can’t reach a Demand zone and turns higher like XLI did, this suggests it has reached a price level where Demand now exceeds Supply.
The Zones:
————-
86.80 – 87.80
BTCUSD – Bitcoin / US Dollar

The Setup:
Bitcoin has been declining for weeks from Supply with little Demand to stop price from reaching the Demand zones below. Also, notice the large Profit Zones between Demand and Supply.
The Logic:
When price just touches Supply and falls like Bitcoin did, this suggests Supply greatly exceeds Demand at that level.
The Zones:
36,000 – 36,800
16,950 – 19,400
Pivot Highs and Lows are NOT Supply & Demand Zones
Often people assume pivot highs and lows are Supply & Demand zones, which is a big mistake. Not only are they not qualified Supply & Demand zones, they actually help open up profit zones which make it easy for price to move through these areas. Think about it, each time price declines and creates the pivot lows (seen circled on the left chart below), what is actually happening is Demand is being filled/absorbed by sell orders. These pivot lows open up the large profit zone which makes it easy for price to decline after turning lower from Supply.

